High loads within a server can severely impact performance and response times. Identifying which process(es) or service(s) causing high loads significantly narrows down the investigation as it allows you to focus on the process(es) that require attention.
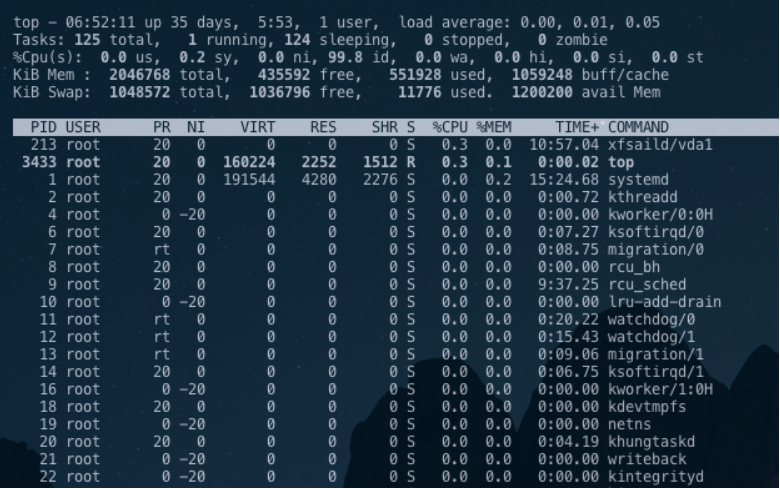
“top” is a popular tool used to list running processes on the server along with information regarding system resource usage. The command usually comes preinstalled in most Linux boxes. To execute the command, simply type “top” within your terminal and press enter. Here’s an example output of the command below:

At first, it may seem like a lot of information, but it’s easy to understand when the output is broken into 2 sections. In the first part of the output (also referred to as the busybox), information regarding the global resource usage that is currently in use is shown. On the third row, 5th column you will see “id” which is short for “idle”. Ideally, you’ll want this number to be high as it represents in percentage how long the processor was idle. It’s worth noting that this information refreshes every 3 seconds. By default, top will automatically sort the list based on CPU consumption, should you wish to sort the process list by most used in Memory instead of CPU, you can press on “shift+m” while top is running to re-sort the list.
In the second section of the output where “PID” is shown, below it is a list of processes currently running on the server. “top” automatically sorts processes with the top consisting of the most resource-intensive processes down to the bottom of the list with the least resource-intensive.
Most of the attention should be geared towards the top of the process list. For the sake of simplicity, you want to focus on the following columns:
[1] PID: This is the Process ID for that particular command or service.
[2] %CPU: This column displays the percentage of CPU in use by that particular process.
[3] %MEM: This column displays the percentage of Memory in use by that particular process.
[4] TIME+: This column shows how long the process has been active.
[5] COMMAND: This column will regularly be the name of the process.
Depending on the overall load of the server and hardware, processes that require attention are usually the ones consistently using over 70% of a single CPU core. It is not uncommon for a process to spike up in usage and disappear.
The next course of action on addressing the process utilizing high load primarily depends on the type of service or command it is. A resolution can range anywhere from optimizing the process to utilize fewer resources or, killing the process if it’s no longer needed.
If you’re unsure of how to proceed with addressing the process, you may benefit from contacting a system administrator for further investigation. If you do not have such an administrator, you may search for one in our listings here:
Please note, however, that cPanel, LLC does not endorse or recommend any particular provider on that list, nor can we be held liable for any services performed by third-party providers, including those on the list.