Post Date: November 20, 2026
Introduction
Monitoring website performance and server resource usage is essential for maintaining a stable and reliable hosting environment. High CPU consumption, insufficient memory, disk I/O bottlenecks, and excessive traffic can affect website loading times and overall server performance.
Plesk Obsidian provides built-in monitoring and reporting features that help administrators track server health, resource consumption, website traffic, and individual process usage.
Using these features, administrators can identify resource-intensive processes, investigate performance issues, and take preventive action before they affect hosted websites.
In this article, we will explain how to monitor website performance and resource usage in Plesk, including CPU, RAM, disk space, traffic, and individual website processes.
Prerequisites
Before proceeding, ensure that you have:
- Access to the Plesk control panel.
- Administrator or appropriate subscription permissions.
- Plesk Obsidian installed on your server.
- The Repair Kit extension is installed if you need to use the Process List feature.
- SSH access if you want to perform additional Linux-level resource checks.
1. Monitor Server Resource Usage in Plesk
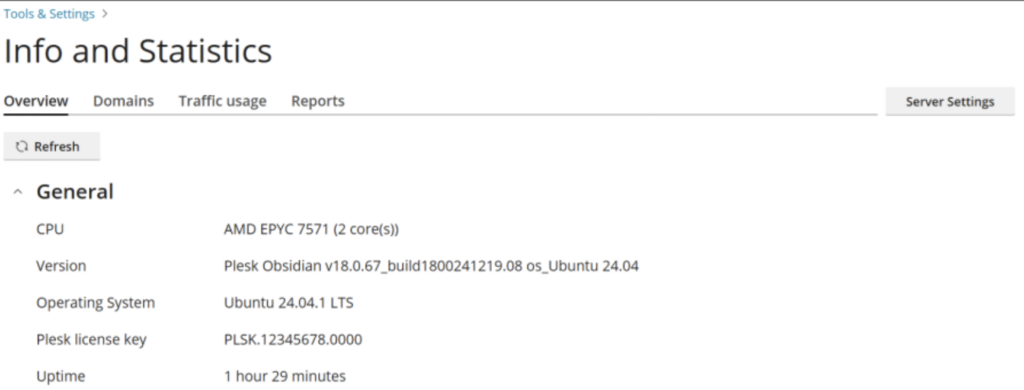
Plesk provides an Info and Statistics section where administrators can check current server resource consumption.
You can monitor:
- CPU usage and processor information.
- RAM and swap memory usage.
- Disk space consumption.
- Server uptime and hosted domain status.
Implementation
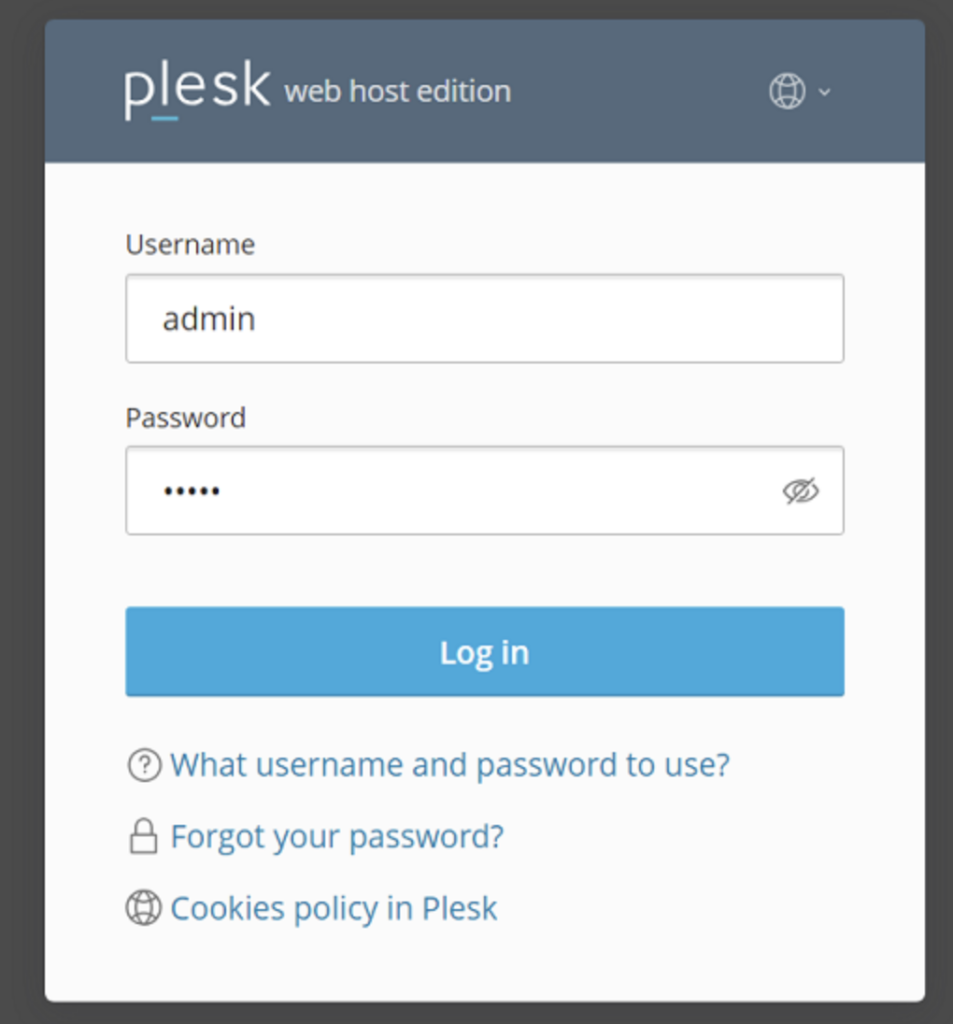
Step 1: Log in to Plesk
Open your Plesk control panel and log in using administrator credentials.
Step 2: Open Info and Statistics
Navigate to:
Tools & Settings → Info and Statistics
This section displays information about the server’s current resource usage.
Step 3: Review Server Resource Consumption
Review the available resource information, including:
- CPU and processor information.
- Installed and used memory.
- Swap space consumption.
- Disk usage by partitions and directories.
- Server uptime and hosted domain status.
Click Refresh if the page has remained open and you want to retrieve updated information.
2. Monitor Server Performance Using Plesk Monitoring
Plesk Obsidian includes a Monitoring feature that helps administrators track resource usage through graphical dashboards and notifications.
It can monitor resources such as CPU, memory, disk, and other server services.
Step 1: Open Monitoring
Log in to Plesk and click Monitoring in the left navigation pane.
If you are opening Monitoring for the first time, select the monitoring mode and complete its activation.
Plesk provides two monitoring modes:
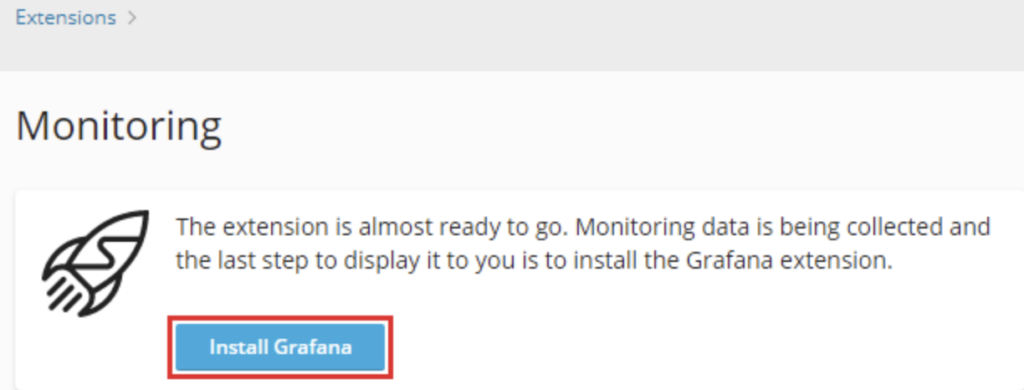
- Built-in Monitoring: Uses the Grafana extension to display server resource metrics.
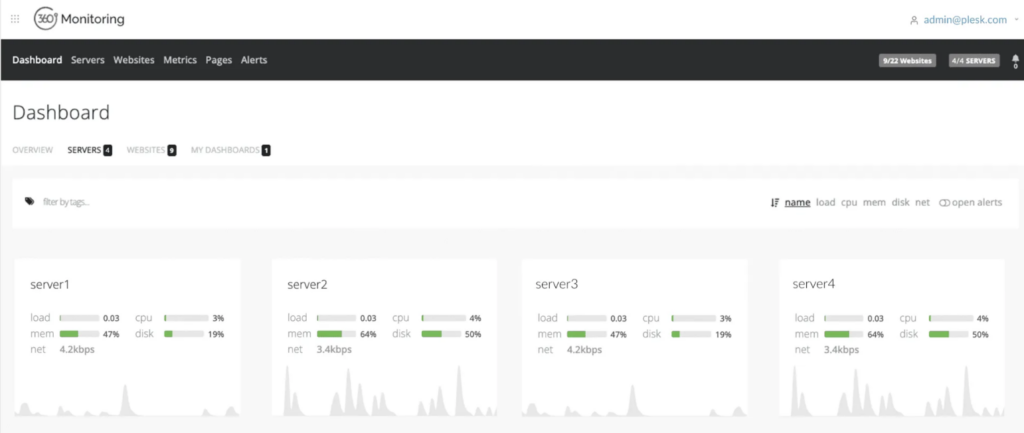
- 360 Monitoring: Connects Plesk to the external Plesk 360 service for monitoring servers and website availability.
Step 2: Review the Monitoring Dashboard
After activating Monitoring, open the Overview tab.
The dashboard displays graphs representing important server resources and services.
You can review the available graphs to identify resource consumption patterns and potential performance issues.
Step 3: Review Individual Resource Graphs
Monitoring organizes resource information into separate categories.
Select the relevant category to review the available metrics and their historical trends.
Use the graphs to identify:
- CPU utilization spikes.
- High memory consumption.
- Disk activity and resource pressure.
- Changes in server resource usage over time.
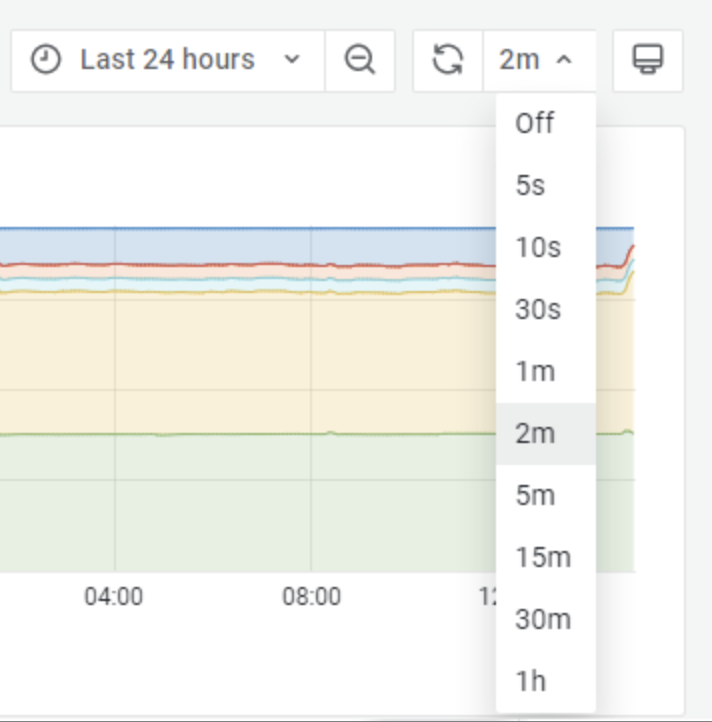
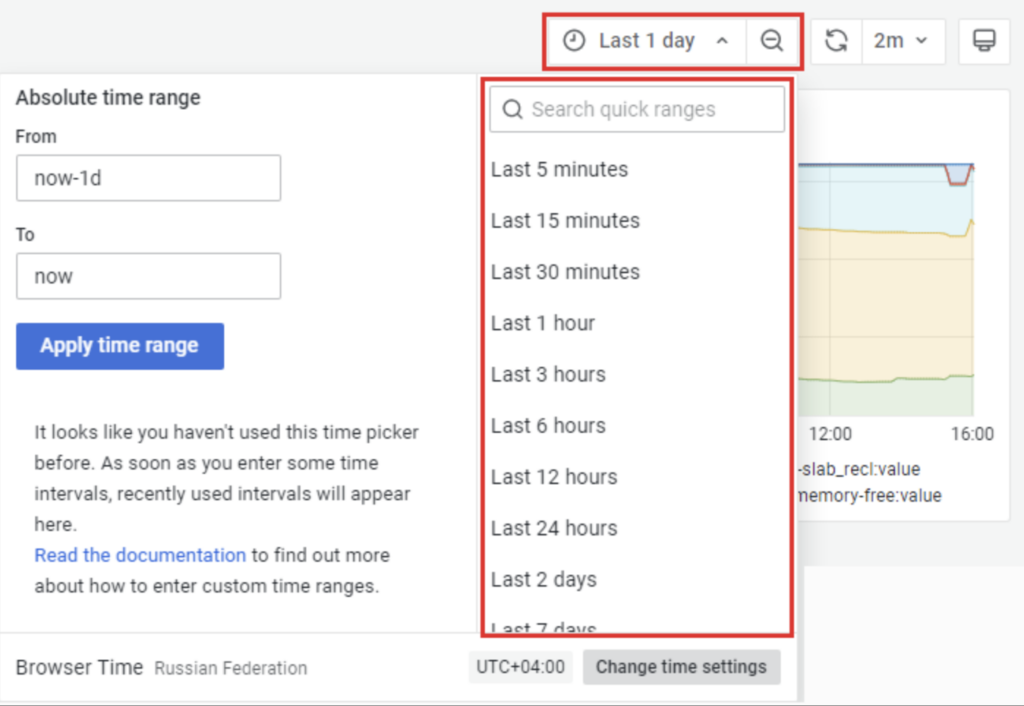
You can also change the time range to investigate resource usage over the last few minutes, hours, or days.
Step 4: Configure Monitoring Notifications
Plesk Monitoring can notify administrators when resource usage exceeds configured thresholds.
To configure notifications:
- Open Monitoring.
- Click Settings.
- Enable notifications for the required resources.
- Configure thresholds where necessary.
- Click Apply to save the changes.
Plesk provides predefined monitoring thresholds. It is generally recommended to retain the default configuration unless you have a specific requirement to change it.
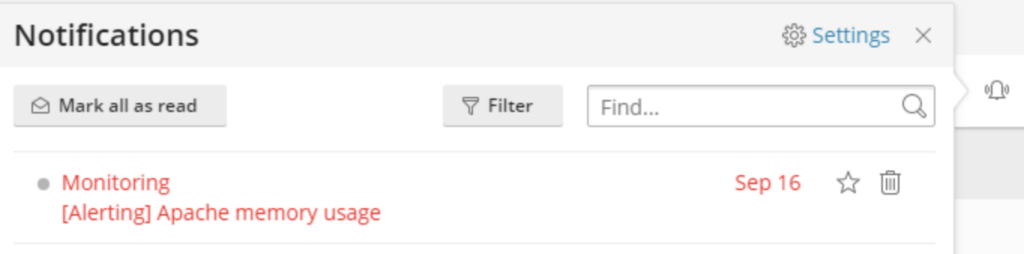
Note: Built-in Monitoring values are not real-time operating-system measurements. The dashboard refreshes periodically. The default refresh interval is two minutes, and it can be adjusted.
3. Monitor CPU, RAM, and Disk I/O for Individual Website Processes
Sometimes, a particular website or application consumes excessive server resources.
Plesk provides a Process List feature through the Repair Kit extension. It allows administrators to identify processes consuming CPU, memory, and disk I/O resources.
Step 1: Check Whether Repair Kit Is Installed
Navigate to:
Extensions → My Extensions
Check whether the Repair Kit extension is installed and enabled.
If it is unavailable, install and enable the extension if supported by your Plesk installation.
Step 2: Open the Process List
Navigate to:
Tools & Settings → Process List
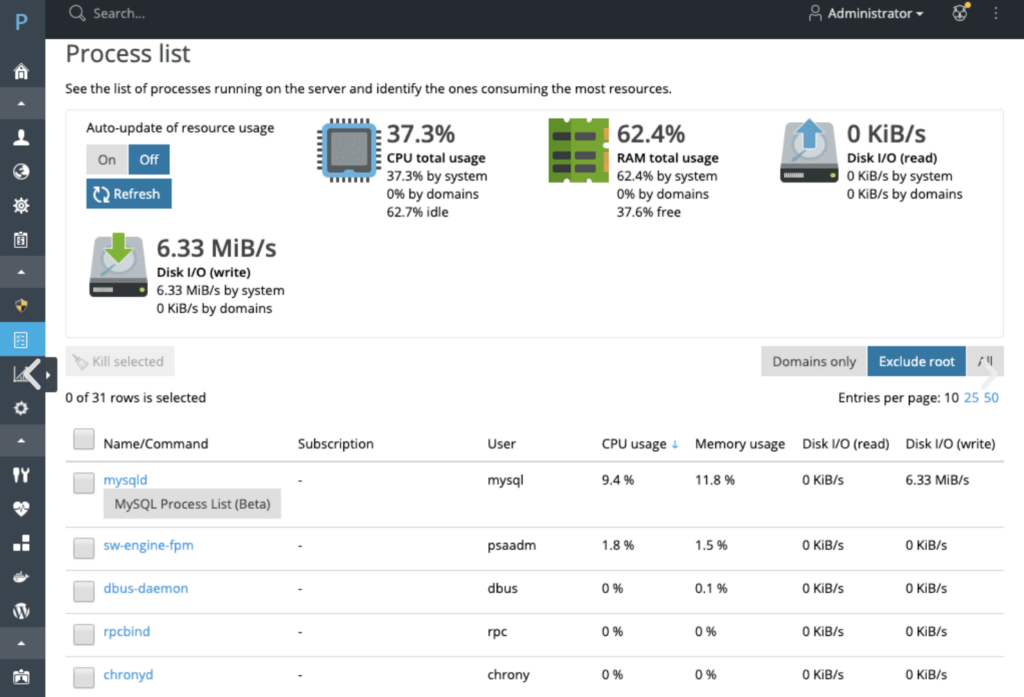
The Process List page displays processes running on the server and their resource consumption.
If the Process List option is unavailable, verify that the Repair Kit extension is installed and enabled.
Step 3: Enable Automatic Resource Updates
On the Process List page, enable Auto-update of resource usage.
This allows the resource consumption information to refresh automatically while you monitor the running processes.
You can also select Domains only to exclude system processes and focus on website-related processes.
Step 4: Identify Resource-Intensive Processes
The Process List provides information about:
| Metric | Description |
|---|---|
| CPU usage | CPU resources consumed by a process |
| Memory usage | RAM consumed by a process |
| Disk I/O (read) | Data read from storage |
| Disk I/O (write) | Data written to storage |
Click the respective column heading to sort processes according to resource consumption.
For example, click Memory usage to identify processes consuming the highest amount of RAM.
This helps administrators identify resource-intensive processes and investigate websites that may be affecting overall server performance.
4. Monitor Website Traffic and Disk Usage
Plesk also provides reporting features to review disk space and traffic consumption by individual websites, customers, and resellers.
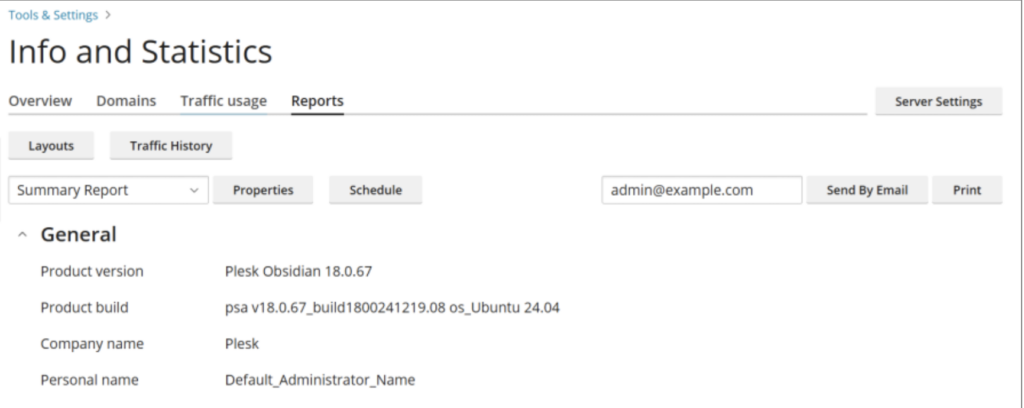
Step 1: Open the Reports Section
Navigate to:
Tools & Settings → Info and Statistics → Reports
The Reports section provides resource usage information through predefined report templates.
Step 2: Select the Report Type
Plesk provides two default report types:
- Summary: Displays general information about customers, resellers, domains, disk space, and traffic usage.
- Full: Provides more detailed resource usage information for individual customers, resellers, and domains.
Select the required report template from the available options.
Step 3: Review Disk Space and Traffic Usage
Review the generated report to identify:
- Total disk space consumption.
- Website and domain storage usage.
- Monthly bandwidth consumption.
- Resource usage by customers and resellers.
You can also access the Traffic usage tab to review traffic consumption for a particular month.
Step 4: Schedule Automatic Reports
If you want to receive resource usage reports regularly, configure automatic report delivery.
- Open Tools & Settings → Info and Statistics → Reports.
- Select the required report template.
- Click Schedule.
- Click Add Schedule.
- Enable the schedule.
- Select the delivery frequency: daily, weekly, or monthly.
- Enter the recipient email address.
- Save the configuration.
Plesk can then generate and deliver reports according to the configured schedule.
5. Monitor Website Visitor Statistics
Apart from server resource consumption, you can also monitor website traffic and visitor activity through Plesk web statistics.
Plesk supports web statistics tools such as Webalizer and GoAccess, depending on the operating system and Plesk version.
Step 1: Open Websites & Domains
Log in to Plesk and navigate to:
Websites & Domains
Locate the domain for which you want to review visitor statistics.
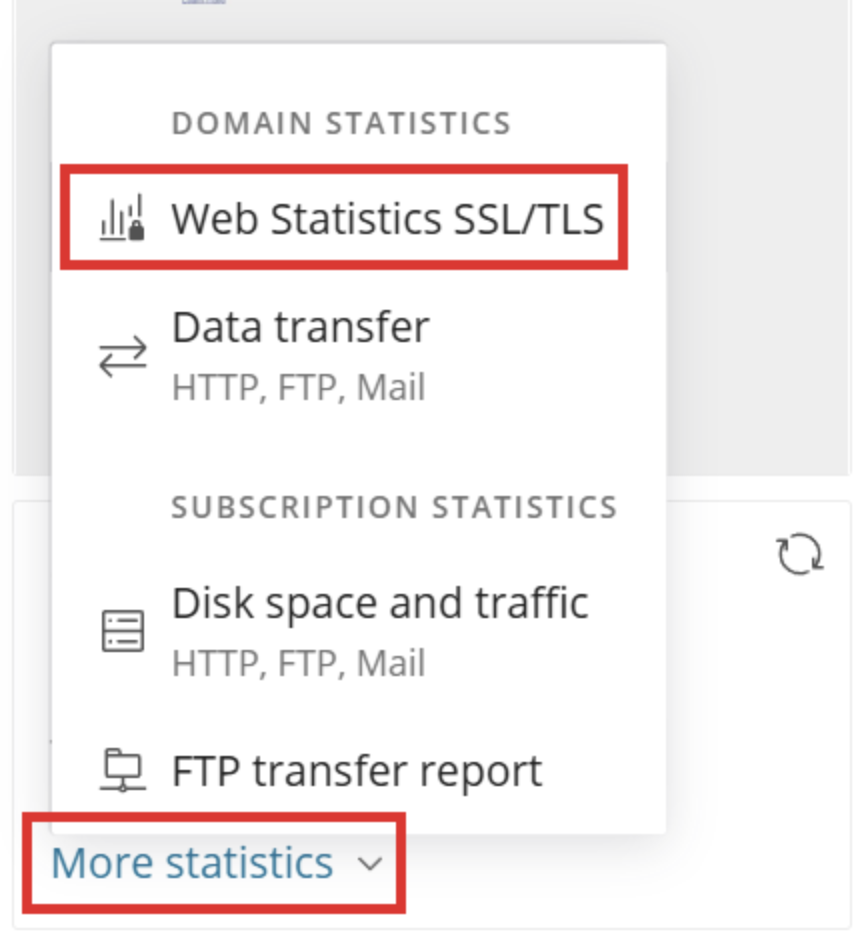
Step 2: Open More Statistics
On the website’s card, locate the Statistics section.
Click More statistics, followed by Web Statistics SSL/TLS.
If prompted, enter the website system user’s credentials.
Step 3: Review Website Traffic Information
The web statistics page displays visitor and request information depending on the selected statistics application.
For example:
- Number of visits.
- Unique visitors.
- Requested files and pages.
- Successful and failed requests.
- Visitor hostnames and IP addresses, where supported.
GoAccess provides more detailed request information than Webalizer.
Note: Plesk generally generates web statistics automatically once every 24 hours. Newly enabled statistics may take time to appear. You can also manually recalculate statistics from the website’s Statistics section.
6. Monitor Resource Usage Through SSH (Linux)
For additional troubleshooting, administrators with SSH access can use standard Linux commands to inspect server resource consumption.
These commands are useful when you need to investigate high resource usage beyond the information displayed in Plesk.
Check CPU and Running Processes
top -cThis displays running processes and their CPU and memory consumption.
Check Memory Usage
free -hThis displays total, used, available, and swap memory.
Check Disk Space
df -hThis displays filesystem disk space usage.
Check Disk I/O
iostat -xz 1 5This displays disk I/O statistics at one-second intervals for five reports. The iostat utility may need to be installed through the sysstat package.
Check System Load
uptimeThis displays system uptime and load averages over the last 1, 5, and 15 minutes.
Note: These commands are for Plesk on Linux. Windows servers require different operating-system tools.
7. Best Practices for Monitoring Website Performance
To maintain a healthy Plesk hosting environment, follow these recommendations:
- Monitor CPU usage regularly: Investigate unexpected or sustained CPU spikes.
- Track memory consumption: Identify processes consuming excessive RAM and check for memory-related issues.
- Review disk usage: Monitor storage availability to prevent websites from running out of disk space.
- Check website traffic: Identify unexpected traffic increases and unusual request patterns.
- Review resource-intensive processes: Use the Process List to identify applications and domains consuming excessive resources.
- Configure monitoring notifications: Enable alerts for important server resources.
- Review historical trends: Compare resource usage over different time periods to identify recurring performance issues.
- Keep Plesk updated: Install supported updates and security fixes to maintain server stability.
Conclusion
Monitoring website performance and resource usage in Plesk helps administrators identify potential server issues before they affect hosted websites.
Using Plesk Monitoring, Info and Statistics, Process List, Reports, and Web Statistics, administrators can track CPU, RAM, disk usage, website traffic, and individual process consumption.
Regular monitoring, appropriate notification settings, and timely troubleshooting help maintain a stable and reliable hosting environment.
Frequently Asked Questions (FAQs)
1. How can I monitor CPU and RAM usage in Plesk?
Log in to Plesk and navigate to Tools & Settings → Info and Statistics to review server resource consumption. You can also use Monitoring for resource graphs and historical trends.
2. How do I identify which website is consuming high server resources?
Use Tools & Settings → Process List. Enable Auto-update of resource usage and select Domains only to focus on website-related processes.
3. What is the Plesk Monitoring feature?
Plesk Monitoring tracks server resource usage through graphical dashboards and can notify administrators when configured resource thresholds are exceeded.
4. How can I check website traffic in Plesk?
Navigate to Websites & Domains, select the website, click More statistics, and open Web Statistics SSL/TLS to review visitor and request information.
5. Can Plesk send automatic resource usage reports?
Yes. Navigate to Tools & Settings → Info and Statistics → Reports, configure a delivery schedule, select the frequency, and provide the recipient email address.
References
- Plesk Documentation – Monitoring
- Plesk Documentation – Viewing Statistics
- Plesk Documentation – Viewing Web Statistics for Websites
- Plesk Support – How to Check Hardware Usage Consumed by a Process of a Website
- Plesk Support – How to Determine What Is Causing High RAM Usage
Related Articles
Need Assistance?
Need help monitoring website performance, identifying resource-intensive processes, or troubleshooting server resource issues in Plesk?
The Pheonix Solutions technical team can assist with Plesk administration, server monitoring, performance optimization, and hosting infrastructure management.
For assistance, contact us.