
Post Date: October 12, 2018
Last Updated: September 29, 2026
Introduction
Nagios is one of the most popular open-source monitoring solutions used to monitor servers, network devices, applications, and services. By adding hosts to Nagios, administrators can proactively monitor system health, resource utilization, and service availability while receiving alerts when issues occur.
In this tutorial, you will learn how to add a new Linux host to a Nagios monitoring server using NRPE (Nagios Remote Plugin Executor). We will create a host configuration file, define service checks, validate the configuration, and restart Nagios to begin monitoring the remote server.
Prerequisites
Before proceeding, ensure the following requirements are met:
- Nagios Core is installed and running on the monitoring server.
- Nagios plugins are installed.
- NRPE is installed and configured on the remote host.
- The Nagios server can communicate with the remote host.
- Firewall rules allow NRPE communication (default port 5666).
- You have root or sudo access to both servers.
Required Packages
nagios-plugins
nagios-nrpe-server
If Nagios is not yet installed, refer to our installation guide:
Nagios Remote Host Monitoring Guide
Monitoring Workflow
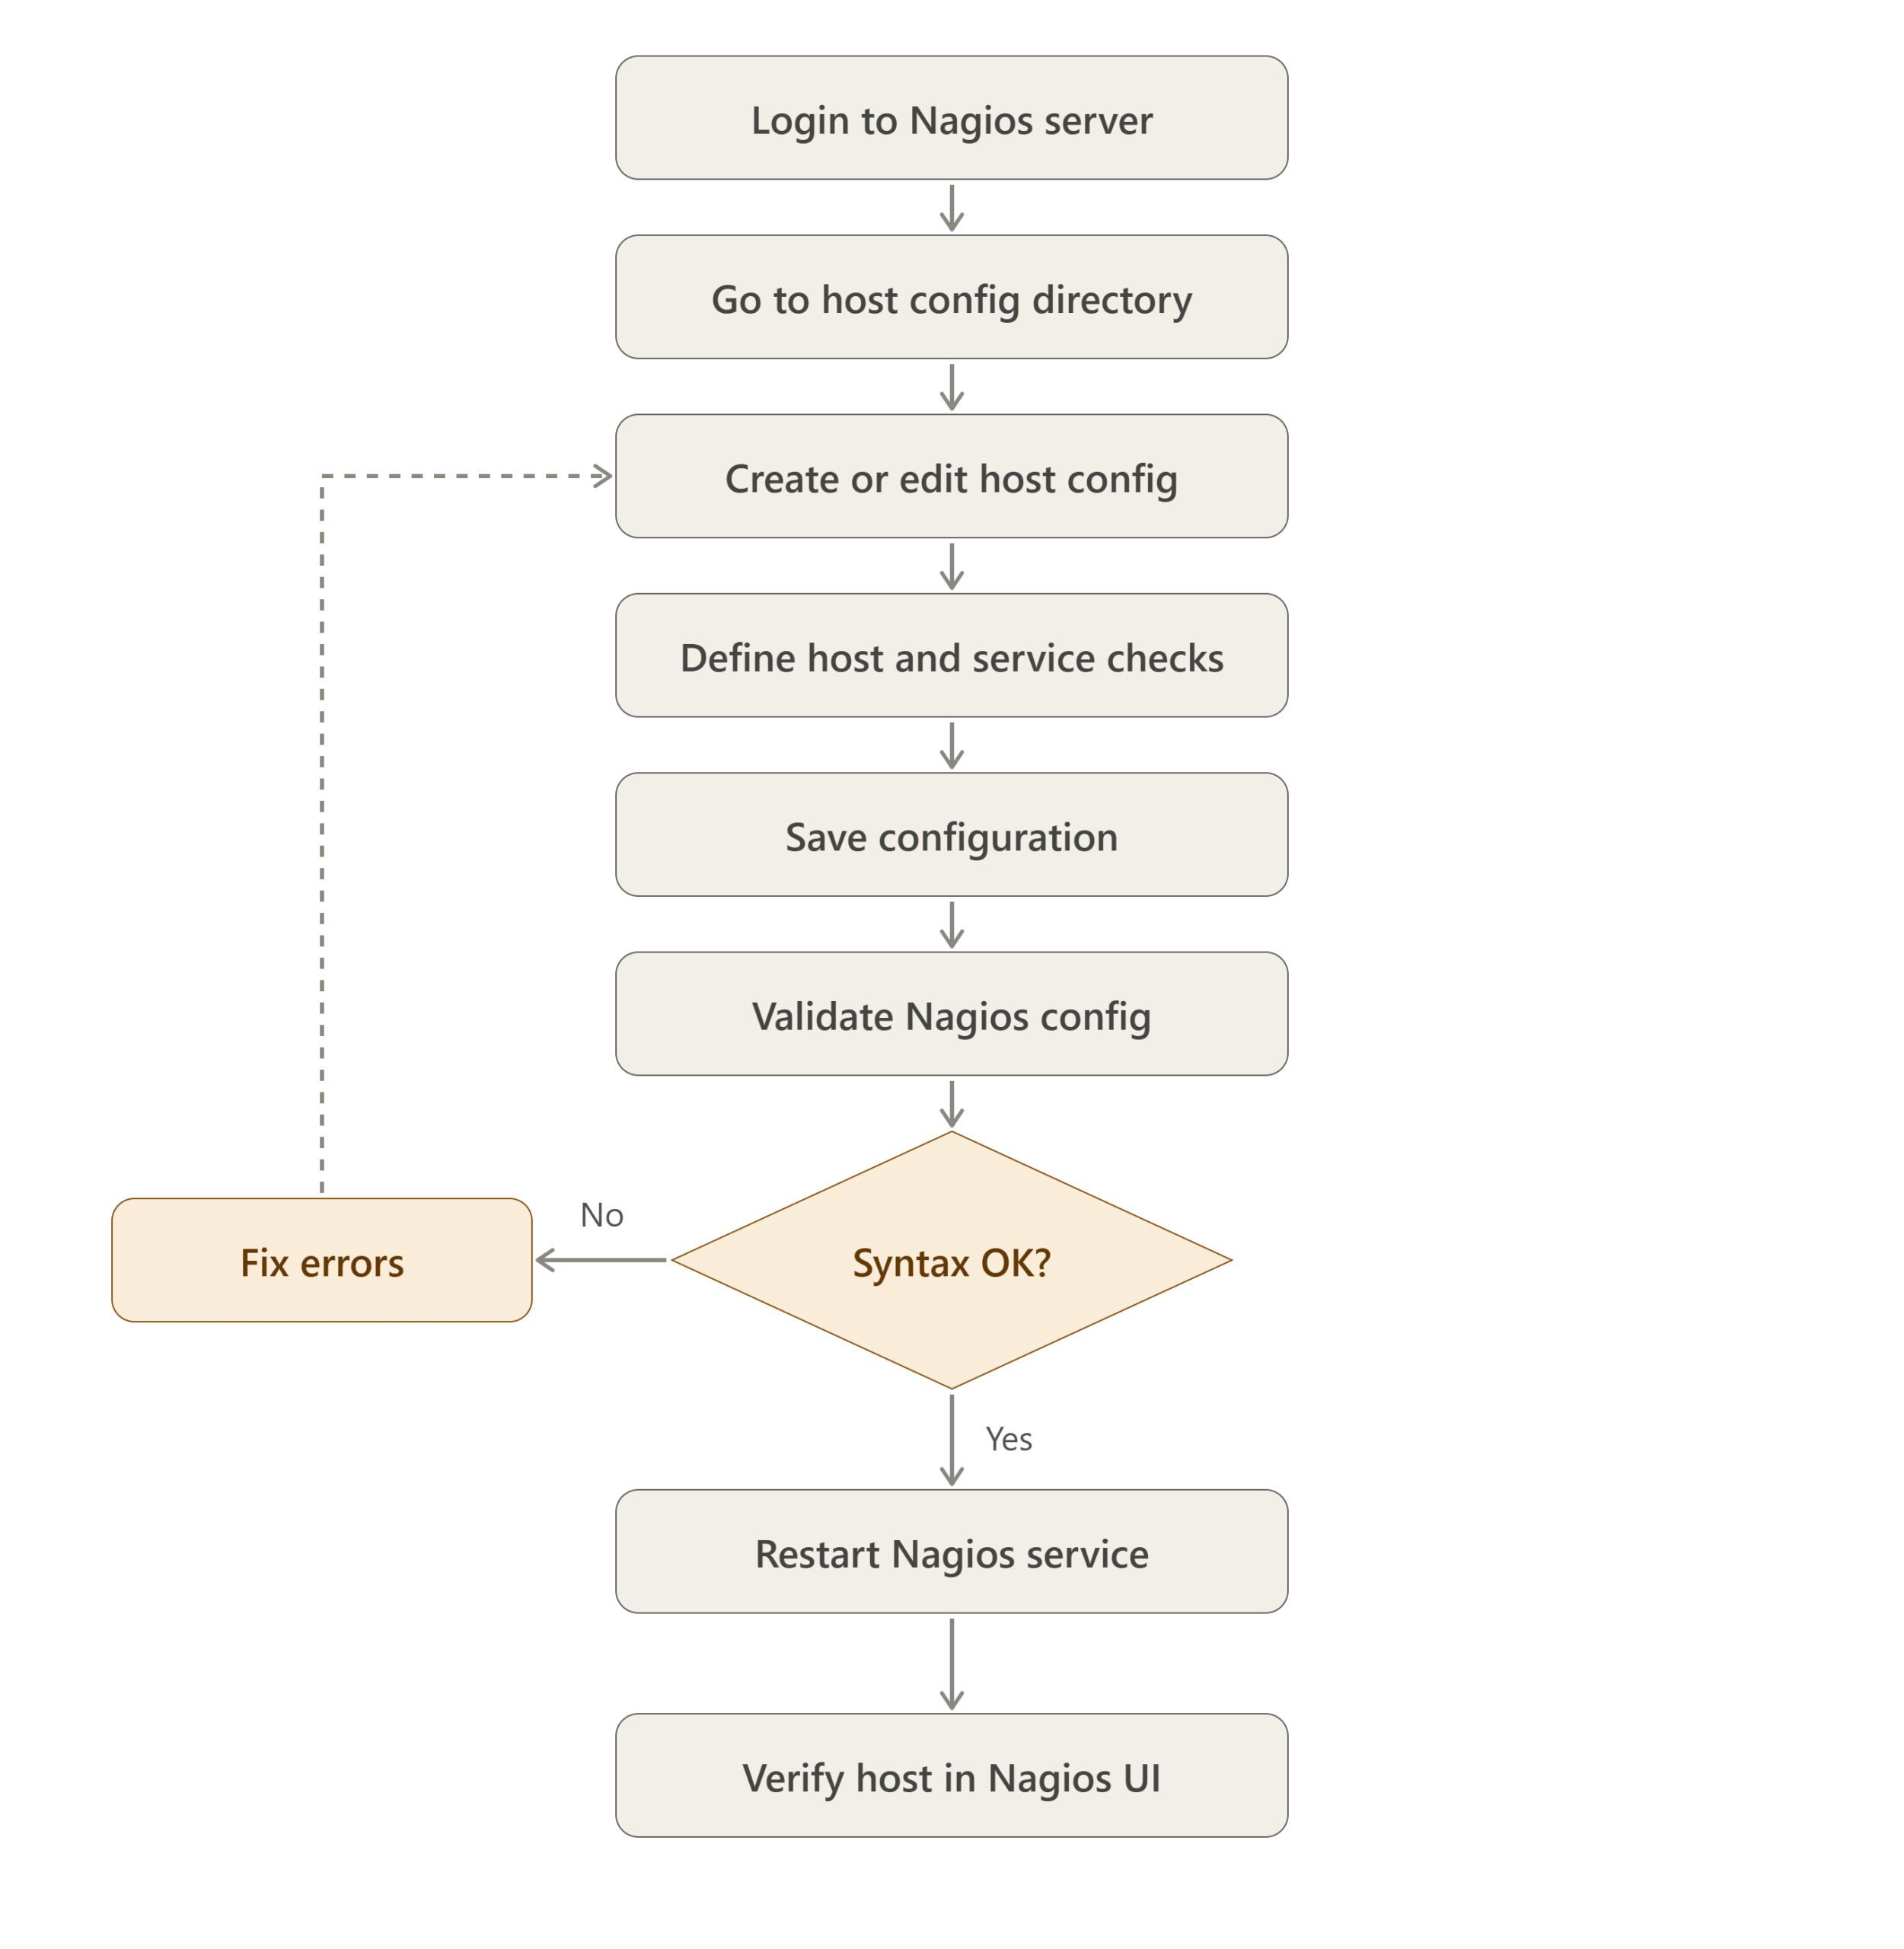
Step 1: Login to the Nagios Monitoring Server
Connect to your Nagios server using SSH.
ssh root@your-nagios-server
Step 2: Navigate to the Host Configuration Directory
Move to the Nagios servers configuration directory.
cd /usr/local/nagios/etc/servers/
This directory contains configuration files for monitored hosts.
Step 3: Create a New Host Configuration File
If the host already exists, you can edit the existing configuration file. Otherwise, create a new file.
For this example, we will create a file named sample.conf.
touch sample.conf
Step 4: Edit the Configuration File
Open the configuration file using your preferred editor.
vi sample.conf
Add the following host and service definitions.
Host Definition
define host {
    use                     linux-server
    host_name               example
    alias                   example
    address                 101.101.101.101
    max_check_attempts      5
    check_period            24x7
    notification_interval   30
    notification_period     24x7
}
Load Monitoring
define service{
    use                     generic-service,nagiosgraph
    host_name               example
    service_description     Load
    check_command           check_nrpe!check_load
}
Disk Monitoring
define service{
    use                     generic-service,nagiosgraph
    host_name               example
    service_description     Disk
    check_command           check_nrpe!check_disk
}
Process Monitoring
define service{
    use                     generic-service,nagiosgraph
    host_name               example
    service_description     Processes
    check_command           check_nrpe!check_procs
}
Configuration Notes
Replace the following values with your server details:
| Parameter | Description |
|---|---|
| host_name | Name displayed in Nagios |
| alias | Friendly display name |
| address | Server IP address |
| example | Replace with your actual hostname |
Save the file and exit the editor.
For Vi editor:
:wq
Step 5: Verify Nagios Configuration
Before restarting Nagios, always perform a syntax check.
/usr/local/nagios/bin/nagios -v /usr/local/nagios/etc/nagios.cfg
Example successful output:
Total Warnings: 0
Total Errors: 0

Things look okay - No serious problems were detected.
If errors are displayed, correct them before proceeding.
Step 6: Restart Nagios Service
After a successful configuration check, restart Nagios.
For Systemd-based systems:
systemctl restart nagios
Verify the service status:
systemctl status nagios
For older systems:
service nagios restart
Step 7: Verify Host Monitoring in Nagios Web Interface
Open the Nagios web interface:
http://your-server-ip/nagios
Navigate to:
Hosts → example
You should see:
- Host Status
- Load Monitoring
- Disk Usage
- Process Monitoring
- Service Performance Graphs (if NagiosGraph is configured)
Allow a few minutes for the first monitoring results to appear.
Troubleshooting
NRPE Connection Failed
Test connectivity from the Nagios server:
/usr/local/nagios/libexec/check_nrpe -H 101.101.101.101
Expected output:
NRPE v4.x.x
Verify NRPE Service
On the remote host:
systemctl status nrpe
Start the service if necessary:
systemctl start nrpe
systemctl enable nrpe
Check Firewall Rules
Ensure port 5666 is open.
firewall-cmd --list-ports
Or:
ufw status
Best Practices
- Use meaningful host names and aliases.
- Organize hosts into separate configuration files.
- Validate configuration before every restart.
- Monitor critical resources such as CPU, memory, disk, and processes.
- Keep NRPE and Nagios plugins updated.
- Document custom monitoring checks for future maintenance.
Conclusion
Adding a host to Nagios is a simple but essential task for centralized infrastructure monitoring. By creating a host configuration, defining service checks, validating the configuration, and restarting Nagios, administrators can quickly begin monitoring remote servers.
Proper monitoring helps identify issues before they impact production systems, improves service availability, and provides valuable insights into system performance. Following the steps in this guide will help you maintain a scalable and reliable Nagios monitoring environment.
Frequently Asked Questions (FAQ)
1. How do I test whether NRPE is working?
Run the following command from the Nagios server:
/usr/local/nagios/libexec/check_nrpe -H <remote-ip>
If NRPE is working correctly, the version information will be displayed.
2. Why is my host showing as DOWN in Nagios?
Common reasons include:
- Incorrect IP address in the configuration.
- Firewall blocking communication.
- NRPE service not running.
- DNS resolution issues.
- Network connectivity problems.
Use:
ping <remote-ip>
to verify connectivity.
3. How can I add more services to monitor?
You can create additional service definitions such as:
define service{
    use                     generic-service
    host_name               example
    service_description     Memory Usage
    check_command           check_nrpe!check_memory
}
The corresponding NRPE command must be configured on the remote server.
Related Article
- Setting up Django and your web server with uWSGI and nginx on Ubuntu
- Configure multiple uwsgi application on nginx
- Configure uwsgi with nginx for Django applications
Talk to our experts
Have a technology challenge or looking for the right solution for your business? Our team can help you with cloud, DevOps, development, infrastructure, design, and more. Feel free to reach out to our experts here.