ELK Stack Configuring Logging.
Introduction:
The ELK Stack (Elasticsearch, Logstash, and Kibana) is the world’s most popular open-source log analysis platform. ELK is quickly overtaking existing proprietary solutions and becoming companies’ top choice for log analysis and management solutions.
- Elasticsearch: Stores and indexes transformed data from Logstash.
- Logstash: Collect logs and event data. It also parses and transforms data and sends it to Elasticsearch.
- Kibana: A visualization tool that runs alongside Elasticsearch to allow users to analyze data and build powerful reports.
Configuring and using ELK Stack :
Installation (Debian-package):
curl -fsSL https://artifacts.elastic.co/GPG-KEY-elasticsearch |sudo gpg --dearmor -o /usr/share/keyrings/elastic.gpg<br>2. echo "deb [signed-by=/usr/share/keyrings/elastic.gpg]
https://artifacts.elastic.co/packages/7.x/apt stable main" | sudo tee -a /etc/apt/sources.list.d/elastic-7.x.list
sudo apt update
sudo apt install elasticsearch
Configurations:
- Elasticsearch is now installed and ready to be configured. Use your preferred text editor to edit Elastic Search’s main configuration file,
elasticsearch.yml - The
elasticsearch.ymlfile provides configuration options for your cluster, node, paths, memory, network, discovery, and gateway. Most of these options are preconfigured in the file but you can change them according to your needs. - Elasticsearch listens for traffic from everywhere on the port
9200. - Start the Elasticsearch service with
systemctl.
Installing and Configuring the Kibana Dashboard :
- We should install Kibana only after installing Elasticsearch.
sudo apt install kibana
sudo systemctl enable kibana
sudo systemctl start kibana
- Kibana is configured only to listen on localhost, we must set up a reverse proxy to allow external access by configuring the web server Apache/Nginx.
- use the
opensslcommand to create an administrative Kibana user which you’ll use to access the Kibana web interface. As an example, we will name this accountkibanaadmin. - The below command will create the administrative Kibana user and password, and store them in the htpasswd.users file to access the Kibana dashboard (nginx webserver authentication access)
echo "kibanaadmin:<code>openssl passwd -apr1</code>" | sudo tee -a /etc/nginx/htpasswd.users
Installing and Configuring Logstash :
- Logstash allows you more flexibility to collect data from different sources, transform it into a common format, and export it to another database.
sudo apt install logstash
Create a configuration file called logstash-input.conf under /etc/logstash/conf.d path.
Insert the following input configuration. This specifies a beats input that will listen on TCP port 5044.
input {
  beats {
    port => 5044
  }
}
Next, create a configuration file called elasticsearch-output.conf under /etc/logstash/conf.d path enter the below commands.
output {
  if [@metadata][pipeline] {
	elasticsearch {
  	hosts => ["localhost:9200"]
  	manage_template => false
  	index => "%{[@metadata][beat]}-%{[@metadata][version]}-%{+YYYY.MM.dd}"
  	pipeline => "%{[@metadata][pipeline]}"
	}
  } else {
	elasticsearch {
  	hosts => ["localhost:9200"]
  	manage_template => false
  	index => "%{[@metadata][beat]}-%{[@metadata][version]}-%{+YYYY.MM.dd}"
	}
  }
}
Test your Logstash configuration with this command :
sudo -u logstash /usr/share/logstash/bin/logstash --path.settings /etc/logstash -t
Then restart the logstash services.
Configuring Filebeat :
The Filebeat configuration file is located on /etc/filebeat/filebeat.yml.
Filebeat will not need to send any data directly to Elasticsearch, so let’s disable that output. To do so, find the output.elasticsearch section and comment out.
- The functionality of Filebeat can be extended with Filebeat modules. In this documentation we will use the system module, which collects and parses logs created by the system logging service of common Linux distributions.
sudo filebeat modules enable system
sudo filebeat modules list
- Filebeat is configured to use default paths for the syslog and authorization logs. In the case of this tutorial, you do not need to change anything in the configuration. You can see the parameters of the module in the
/etc/filebeat/modules.d/system.ymlconfiguration file. - Next, load the index template into Elasticsearch. An Elasticsearch index is a collection of documents that have similar characteristics.
sudo filebeat setup --index-management -E output.logstash.enabled=false -E 'output.elasticsearch.hosts=["localhost:9200"]'
- Filebeat comes packaged with sample Kibana dashboards that allow you to visualize Filebeat data in Kibana. Before you can use the dashboards, you need to create the index pattern and load the dashboards into Kibana.
- Filebeat connects to Elasticsearch to check version information. To load dashboards when Logstash is enabled, you need to disable the Logstash output and enable Elasticsearch output.
sudo filebeat setup -E output.logstash.enabled=false -E output.elasticsearch.hosts=['localhost:9200'] -E setup.kibana.host=localhost:5601
Now you can start and enable the filebeat.
Exploring Kibana Dashboards
- In a web browser, go to the DNS or public IP address of your Elastic Stack server.
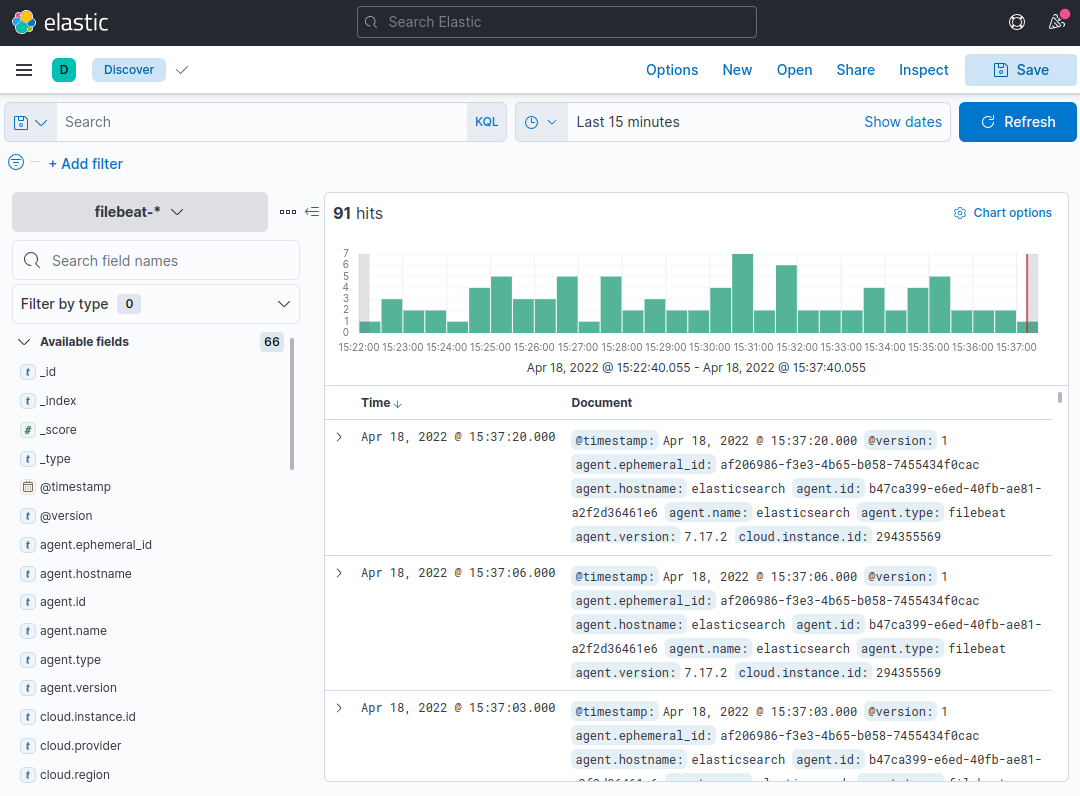
- Click the Discover link in the left-hand navigation bar (you may have to click the the Expand icon at the very bottom left to see the navigation menu items). On the Discover page, select the predefined filebeat-* index pattern to see Filebeat data. By default, this will show you all of the log data over the last 15 minutes. You will see a histogram with log events, and some log messages below.
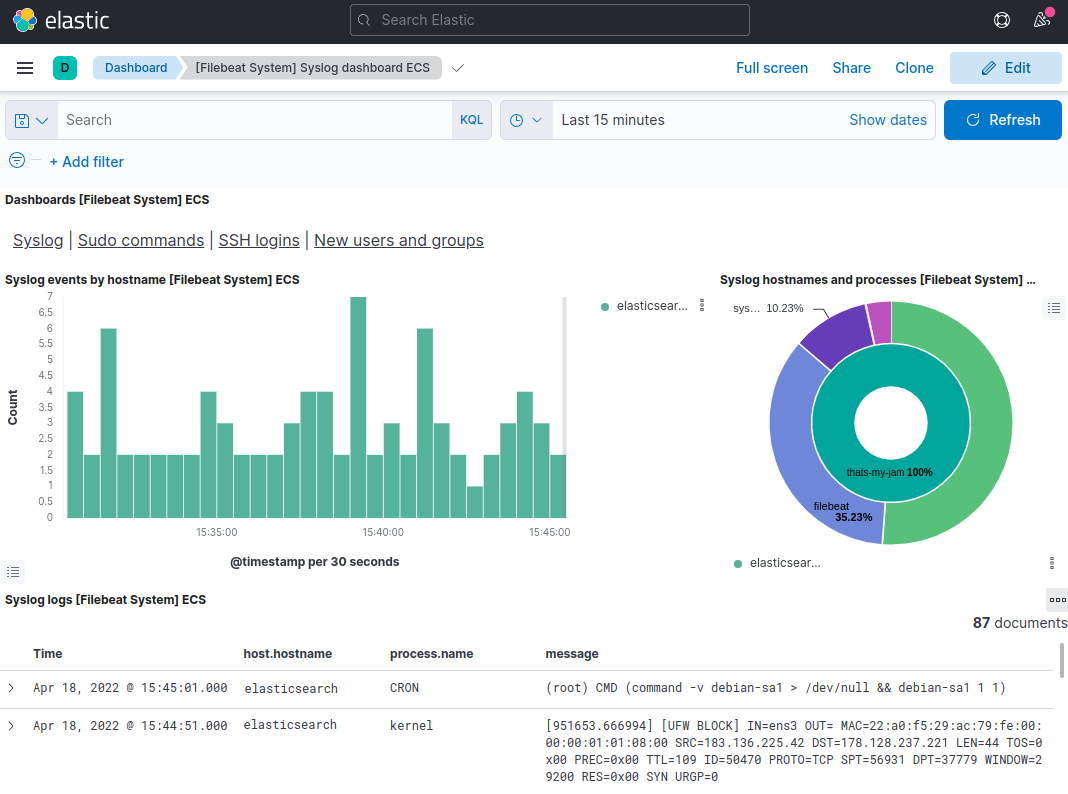
Use the left-hand panel to navigate to the Dashboard page and search for the Filebeat System dashboards. Once there, you can select the sample dashboards that come with Filebeat’s system module.