DEPLOYING A CONTAINERIZED GRAFANA USING DOCKER
Introduction
In the modern DevOps and cloud landscape, monitoring and visualization are essential for maintaining reliable and high-performing systems. Manually tracking metrics and logs across servers can be repetitive, unreliable and time-consuming.
That’s where Grafana comes in, a powerful open-source tool for creating interactive dashboards and visual metrics. It allows you to monitor applications, servers, and services in real time, set up alerts, and gain actionable insights effortlessly.
In this guide, we will show you step-by-step how to install and run Grafana using Ubuntu Server and Docker, set up a containerized monitoring system, and configure default email alerts for notifications.
Prerequisites
Before getting started, make sure you have:
1. Ubuntu Server—The server where Grafana will be installed using Docker.
Example: Ubuntu 24.04 server.
2. Docker Installed—Docker must be installed on the test server to run Grafana in a container.
Example: Docker 29.02 or the latest stable version.
3. Email Account—Required to receive default Grafana alert notifications and to enable two-factor authentication (2FA) for these notifications.
4. Basic Knowledge of Grafana—Familiarity with dashboards and alerts is helpful but not mandatory.
Step 1: Install Docker on Ubuntu
1. The first step is to install Docker on ubuntu server
| $ sudo apt update $ sudo apt install docker.io -y |
2. Verify the installation
| $ docker –version |
Step 2: Dockerfile for Grafana Email setup
1. Create a new folder for the custom Grafana image
| $ mkdir grafana-docker $ cd grafana-docker |
2. Create a Dockerfile
| $ sudo nano Dockerfile |
3. Dockerfile for Custom Grafana Setup
FROM grafana/grafana:latest ENV GF_SECURITY_ADMIN_PASSWORD=”YOUR_PASSWORD_HERE” ENV GF_SMTP_ENABLED=true ENV GF_SMTP_HOST=”smtp.gmail.com:587″ ENV GF_SMTP_USER=”your_email@gmail.com” ENV GF_SMTP_PASSWORD=’your_password’ ENV GF_SMTP_FROM_ADDRESS=”your_email@gmail.com” EXPOSE 3000 |
4. Build the Custom Grafana Image
| $ docker build -t custom-grafana . |
5. Verify it builds using docker images
| $ docker images |
6. Run the New Grafana Container
| $ docker run -itd -p 3000:3000 –name=grafana -v grafana-storage:/var/lib/grafana custom-grafana |
7. Verify Docker Container Execution
| $ docker ps -a |

Step 3: Access Grafana Dashboard
Once the container is running, open your browser and go to
| http://<server ip>:3000 |
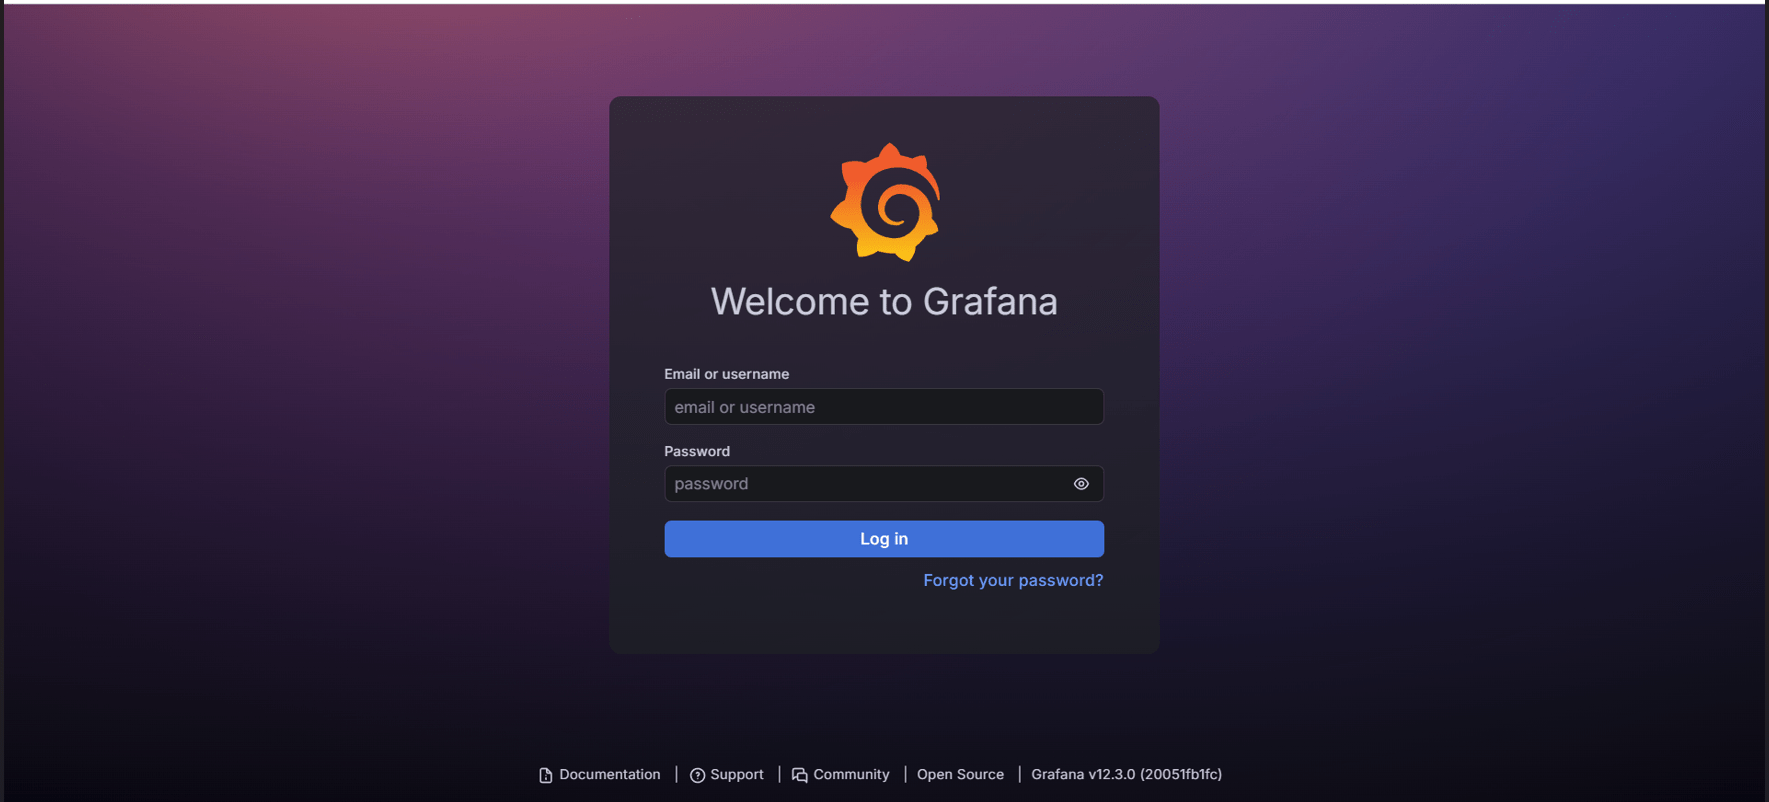
1. Access Grafana Login page
Log in with the previously created username and password.
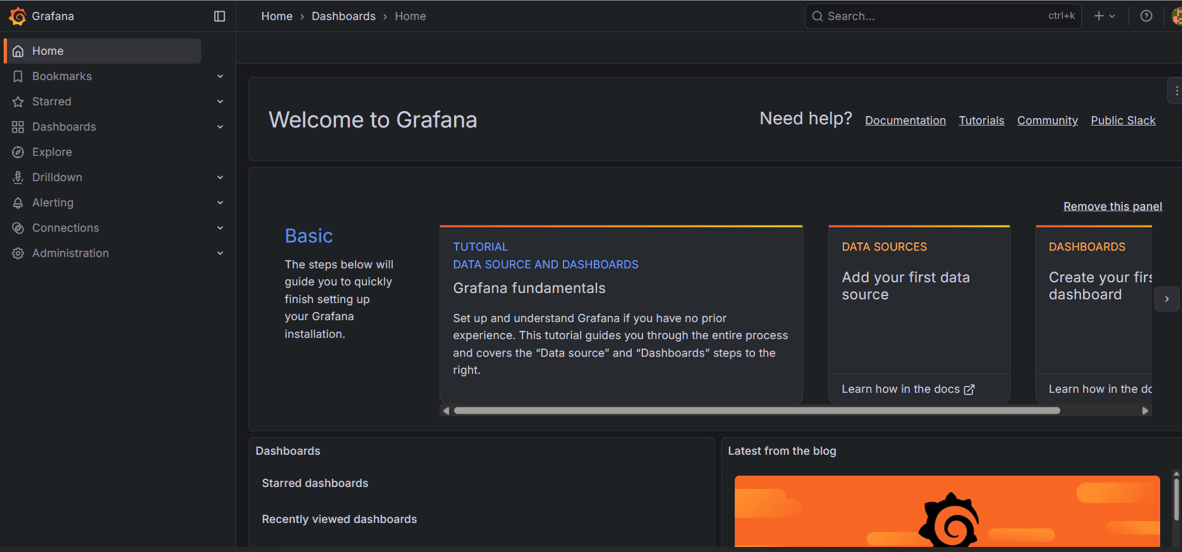
2. Access Grafana Welcome Screen
Step 4: Test Email Notifications
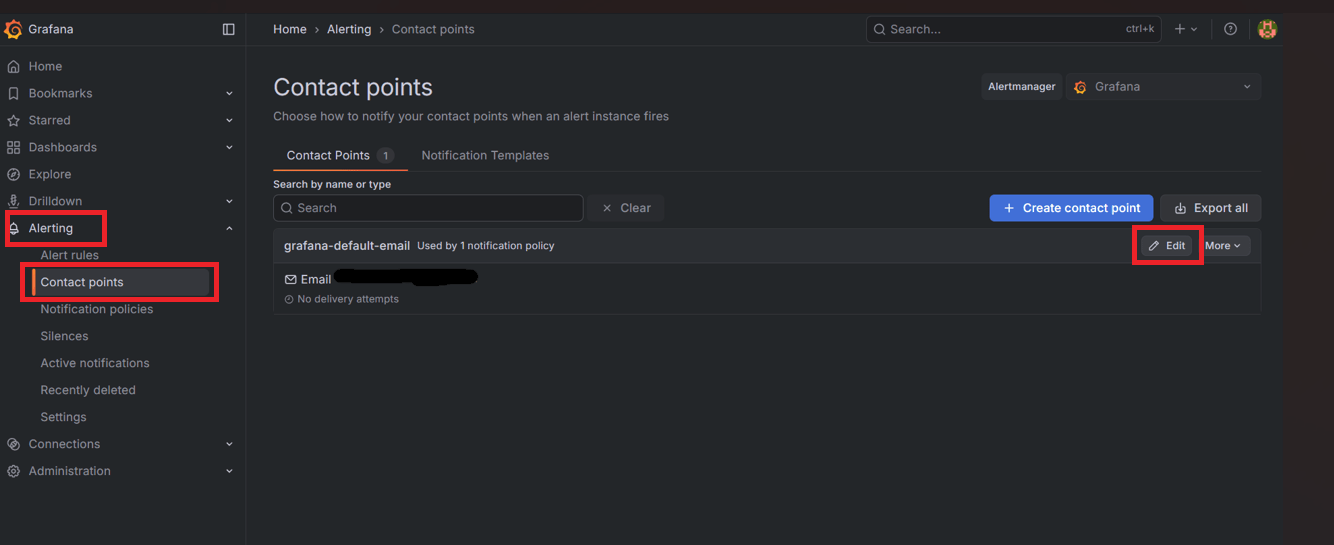
1. Inside the Grafana dashboard, navigate to
| Alerting → contact points → Email → Edit |
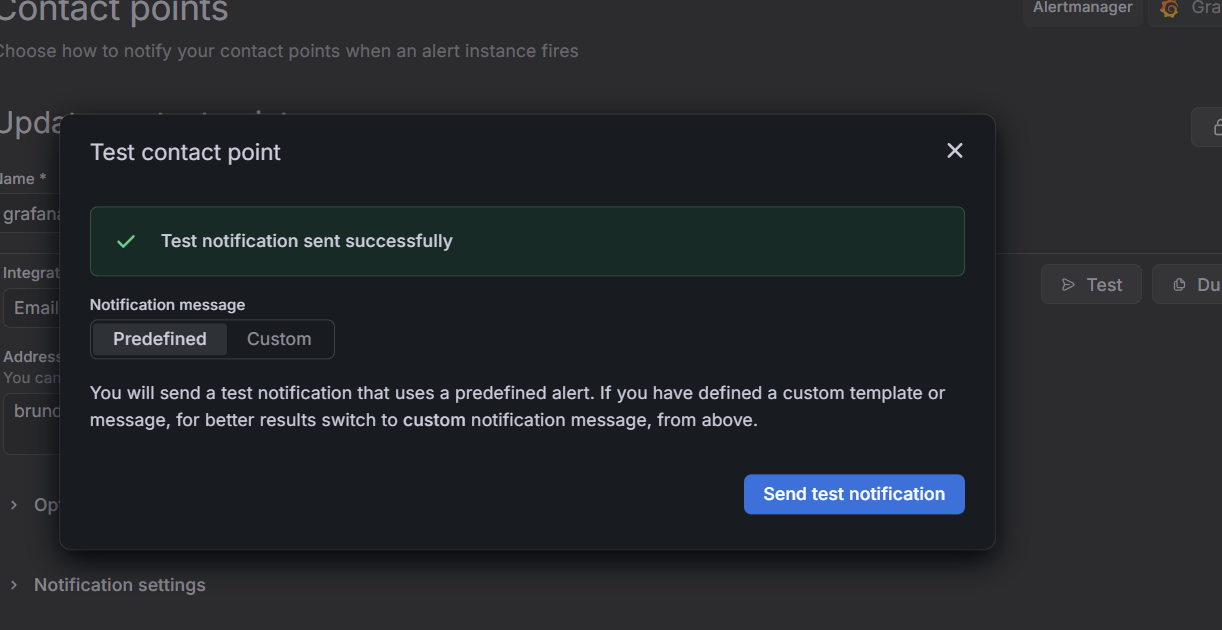
2. Add an email address:
| Add Email Address → Save Contact Points → Test |
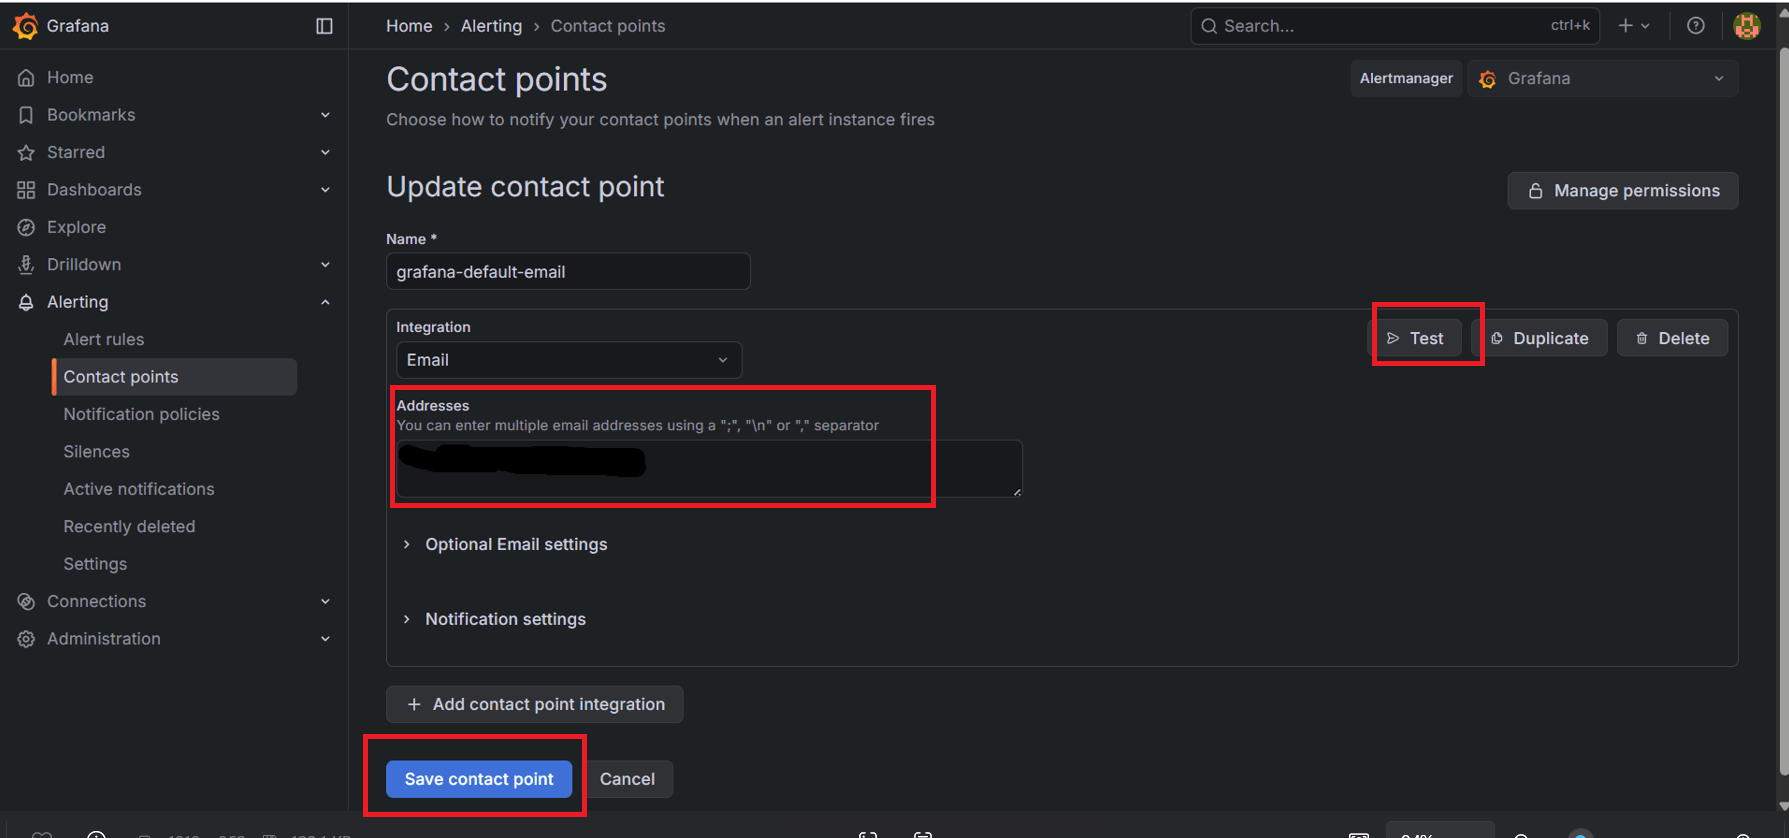
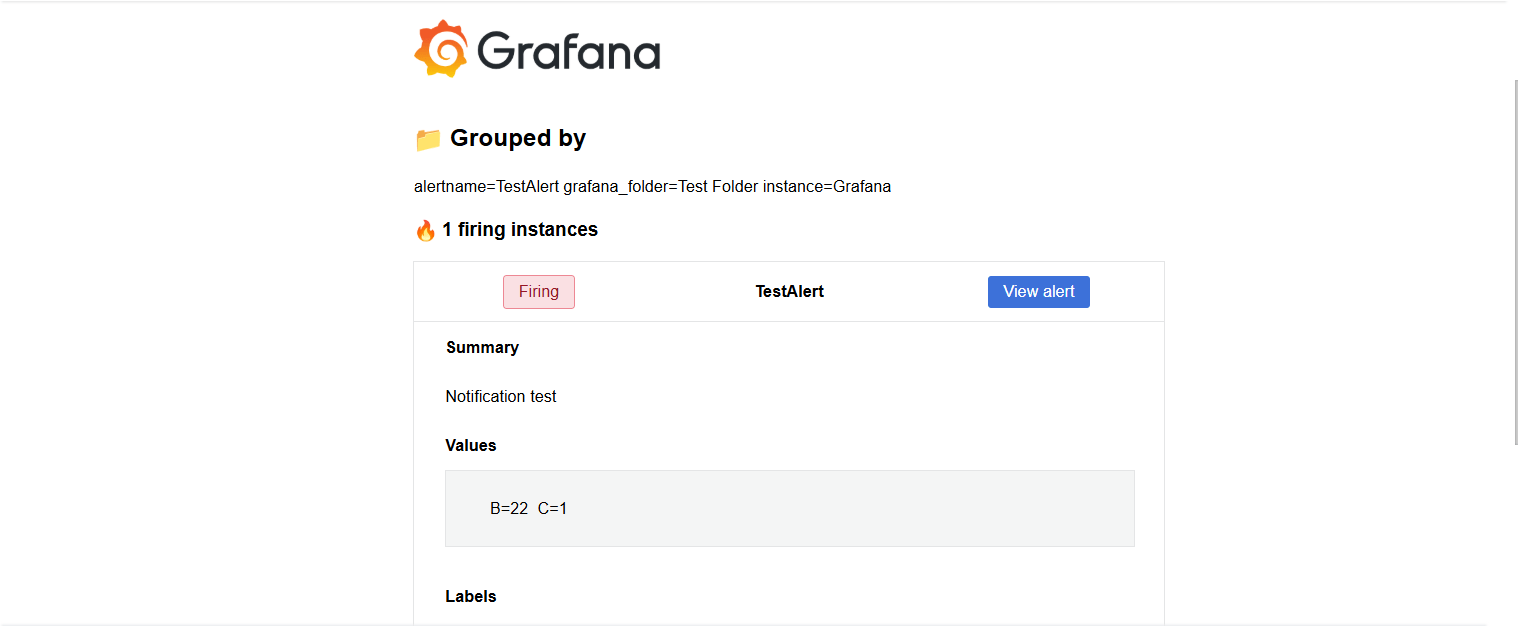
3. Verify Grafana sends a predefined test alert message to Gmail.
Conclusion
Deploying Grafana with Docker creates a fast, clean, and well-organized monitoring setup. It removes complicated installation steps and provides a smooth way to start visualizing system data. This approach supports consistent, reliable monitoring for both small and large environments. Grafana’s dashboards and alerting features make it easy to spot issues early and maintain system stability. Simple to deploy and effortless to manage, Grafana delivers powerful real-time insights that improve overall monitoring efficiency.