How to Create a Dashboard in Metabase
You can create insightful dashboards with Metabase, a robust, open-source business intelligence tool, without requiring complex technical knowledge. Metabase facilitates the visualisation and sharing of data for developers, business owners, and data analysts alike. This tutorial will cover installation, data connection, and dashboard creation as we go through the steps of building a Metabase dashboard from scratch.
What is Metabase?
Building interactive dashboards, creating visualisations, and querying databases are all made possible by the user-friendly Metabase platform. It is perfect for teams aiming to democratise data access and supports a variety of databases, including PostgreSQL, MySQL, and SQL Server.
Step 1: Install and Set Up Metabase
Option 1: Use Metabase Cloud
- Visit Metabase Cloud and sign up for a hosted instance.
- Follow the setup wizard to create an account and configure your instance.
- No server management is required, making this ideal for quick starts.
Option 2: Self-Host Metabase
- Download Metabase: Go to Metabase.com and download the open-source version (JAR file or Docker image).
- Run Metabase:
- JAR File: Ensure Java (JDK 11 or higher) is installed, then run:
java -jar metabase.jar - Docker: Pull and run the Metabase Docker image:
docker run -d -p 3000:3000 --name metabase metabase/metabase
- JAR File: Ensure Java (JDK 11 or higher) is installed, then run:
- Access Metabase at
http://localhost:3000and complete the setup wizard:- Create an admin account.
- Set your language and preferences.
Step 2: Connect Your Data Source
- Log in as Admin: Use your admin credentials to access the Metabase admin panel.
- Add a Database:
- Go to Admin Panel > Databases > Add Database.
- Select your database type (e.g., PostgreSQL, MySQL, etc.).
- Enter connection details:
- Host (e.g.,
localhostor your database server IP). - Port (e.g.,
5432for PostgreSQL). - Database name, username, and password.
- Host (e.g.,
- Click Save.
- Test the Connection: Metabase will verify the connection. If successful, your database tables will be available for querying.
Step 3: Create Questions (Visualisations)
- Navigate to the Data Browser:
- Click New > Question from the top-right menu.
- Select your database and table.
- Build a Query:
- SQL Mode: Write custom SQL queries for advanced analysis.
For example:SELECT * FROM users WHERE company = 'XYZsolution';
- SQL Mode: Write custom SQL queries for advanced analysis.
- Choose a Visualisation:
- After running the query, select a visualisation type (e.g., bar chart, line chart, pie chart) from the visualisation options.
- Customise settings like labels, colours, or axes.
- Save the Question
- Click Save, give the question a name, and choose a collection to store it.
- Optionally, add a description for clarity.


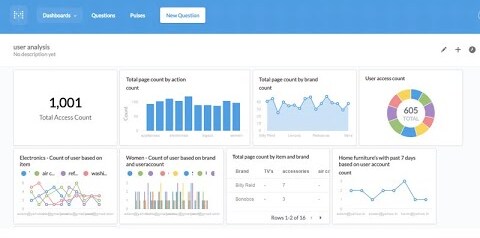
Step 4: Build a Dashboard
- Create a New Dashboard:
- Click New > Dashboard from the top-right menu.
- Name the dashboard (e.g., “Sales Overview”) and save it to a collection.
- Add Questions to the Dashboard:
- Click Add a Card and select saved questions from your collections.
- Arrange cards by dragging and resizing them for a clean layout.
- Customise the Dashboard:
- Add text cards for titles or descriptions: Click Add a Text Card and write in Markdown.
- Apply filters (e.g., date range, category) to make the dashboard interactive:
- Click Add a Filter and map it to relevant questions.
- Example: Add a date filter to sync all visualisations to a specific time period.
- Save and Share:
- Click Save to finalise the dashboard.
- Share it with your team via a public link (enable in Admin > Settings > Public Sharing) or restrict access to specific users.

Best Practices for Metabase Dashboards
- Keep It Simple: To prevent overburdening users, concentrate on important metrics.
- Use Clear Titles: Give questions and dashboards clear names that correspond to their intended use.
- Leverage Collections: Organise questions and dashboards into collections for easy access.
- Test Filters: Ensure filters work across all relevant cards for a seamless experience.
- Optimise Performance: For large datasets, use database views or materialized views to speed up queries.
Conclusion
You can turn raw data into actionable insights by creating a Metabase dashboard, which is simple yet effective. Your team can make data-driven decisions if you connect your data, create insightful questions, and create an interactive dashboard. It is the preferred business intelligence tool due to its versatility and user-friendliness, regardless of whether you are using Metabase Cloud or a self-hosted instance.