Install metric beat and configure for CPU, disk and memory monitoring in ELK.
Introduction:
Metricbeat is a lightweight shipper for collecting and forwarding system and service metrics to Elasticsearch, Logstash, or another data processor. It periodically collects data from configured metric sets and sends it to a specified output.
Prerequisite:
1. Need Elastic search, Logstash and Kibana preconfigured server.
2. Allow the required port to receive the Metrics data in that logstash.
Configurations:
- Log in to the client-server on which you want to monitor the metrics.
- Install metric beat from the community release or use the commands belowto install and untar the file.
curl -L -O https://artifacts.elastic.co/downloads/beats/metricbeat/metricbeat-8.12.1-linux-x86_64.tar.gz
tar xzvf metricbeat-8.12.1-linux-x86_64.tar.gz
cd metricbeat-8.12.1-linux-x86_64
3. In the metricbeat.yml config file need to add the URL of Elasticsearch, Password and protocol, as like below. mentioned text.
- Configurations for Managed ELK (AWS-Marketplace, ELK cloud etc.,) metricbeat.yml
# =============================== Elastic Cloud ================================
# These settings simplify using Metricbeat with the Elastic Cloud (https://cloud.elastic.co/).
# The cloud.id setting overwrites the `output.elasticsearch.hosts` and
# `setup.kibana.host` options.
# You can find the `cloud.id` in the Elastic Cloud web UI.
# ================================== Outputs ===================================
# Configure what output to use when sending the data collected by the beat.
# ---------------------------- Elasticsearch Output ----------------------------
output.elasticsearch:
  cloud_id: "Paste the URL of your Managed Elastic serch"
  cloud.auth: "Enter the password to get access the above link"
  protocol: "https"
  # Array of hosts to connect to.
  # hosts: ["localhost:9200"]
  # Performance preset - one of "balanced", "throughput", "scale",
  # "latency", or "custom".
  preset: balanced
2. Configurations for a standalone ELK server – metricbeat.yml
# =============================== Elastic Cloud ================================
# These settings simplify using Metricbeat with the Elastic Cloud (https://cloud.elastic.co/).
# The cloud.id setting overwrites the `output.elasticsearch.hosts` and
# `setup.kibana.host` options.
# You can find the `cloud.id` in the Elastic Cloud web UI.
# ================================== Outputs ===================================
# Configure what output to use when sending the data collected by the beat.
# ---------------------------- Elasticsearch Output ----------------------------
output.elasticsearch:
  protocol: "http"
  # Array of hosts to connect to.
  hosts: ["<ELK-host-ip>:9200"]
  username: "<elasticsearch-username>"
  password: "<elasticsearch-password>"
  # Performance preset - one of "balanced", "throughput", "scale",
  # "latency", or "custom".
  preset: balanced
4. After the config file is updated use the below command to run the metricbeat
./metricbeat -e -c metricbeat.yml &5. The metric beat service is run check by using this command.
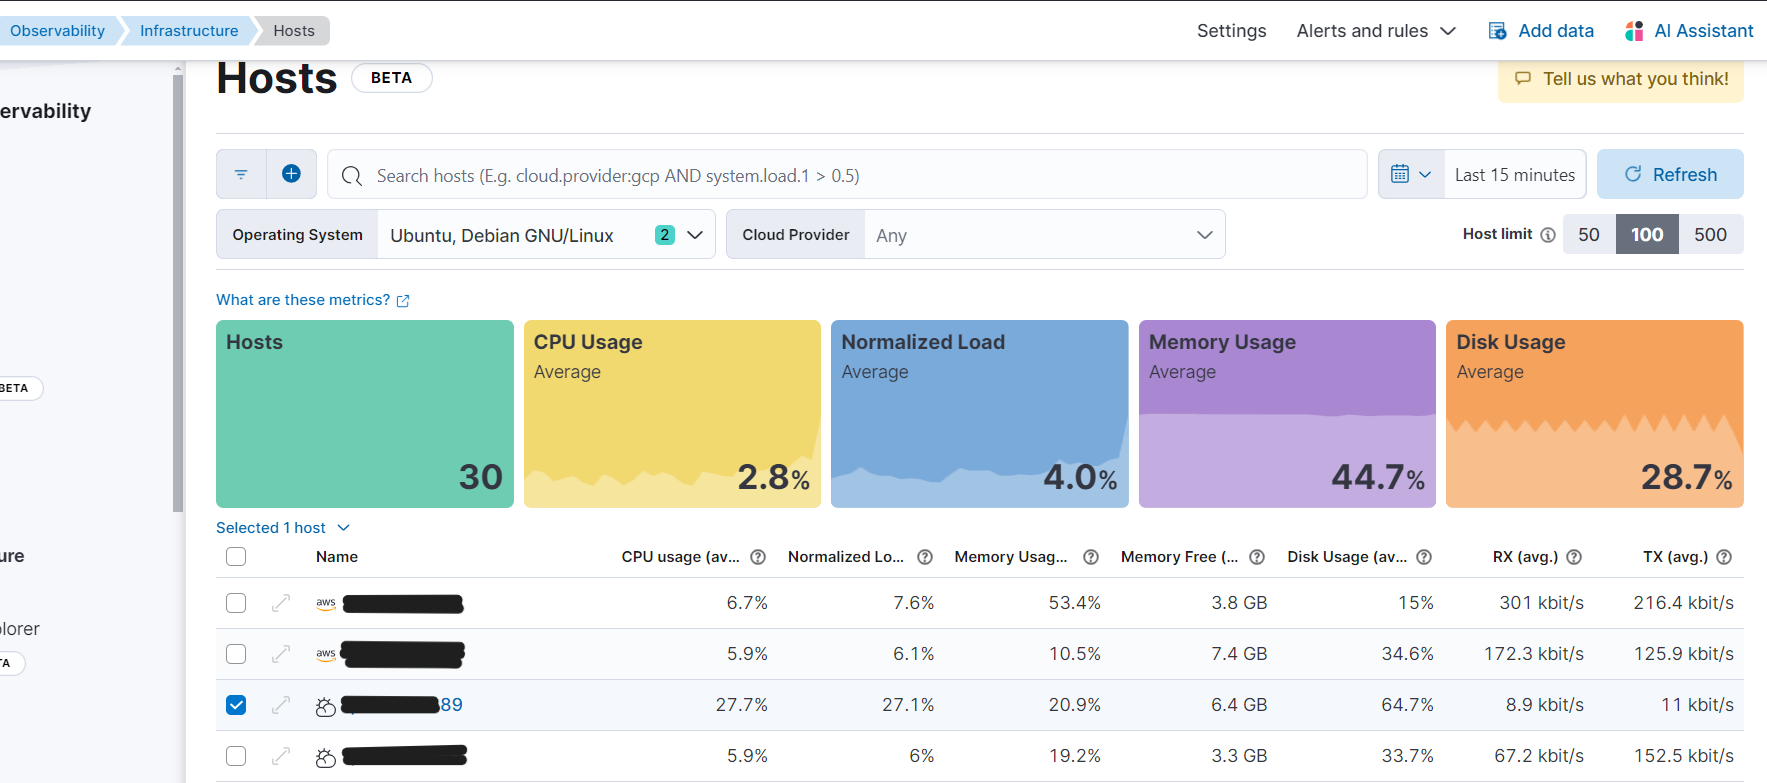
ps aux | grep metricbeat6. After that, check the hosts in Elastic URL -> Observability->Infrastructure->Hosts.
Meticbeat is running successfully on the remote server.
IP will be listed on the Hosts Tab.
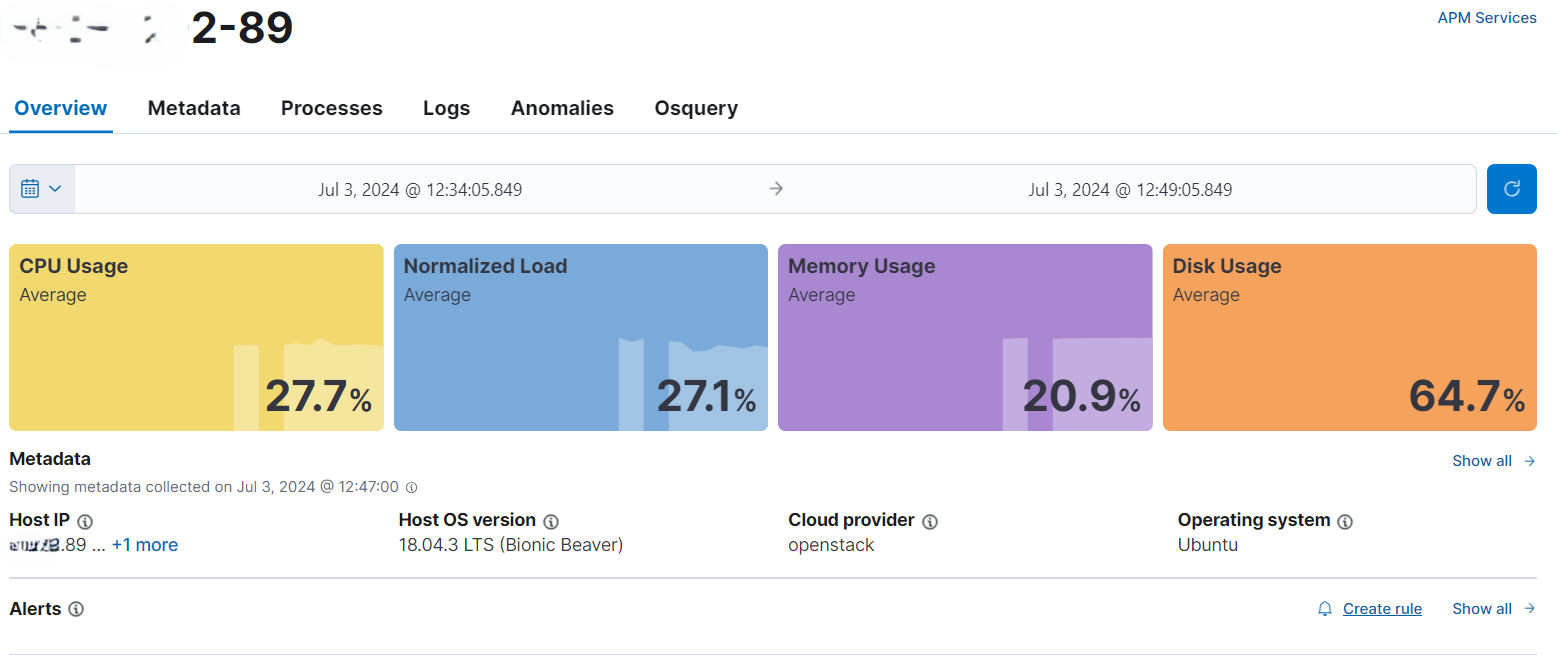
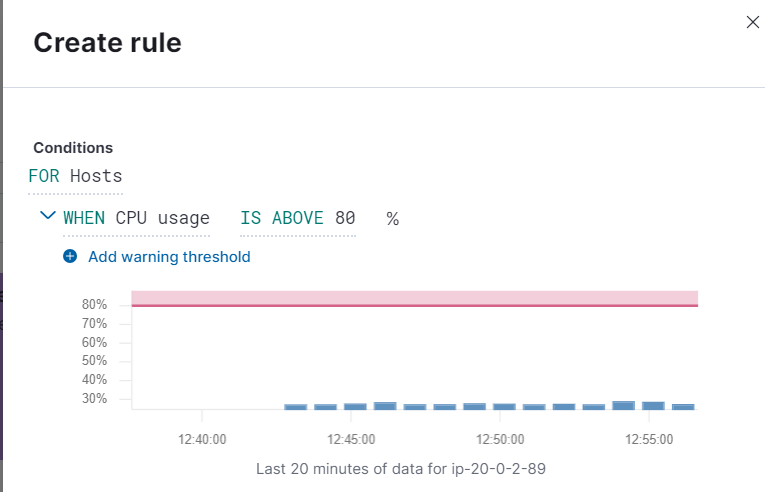
7. Select the IP (sample-ip-xx-xx-2-89) and choose to create a rule.
8. Choose the Create Rule option pop-up window on the right side, will enter the Name column metric alert Name (CPU)
Name – xxxxxx CPU Utilisation Monitor
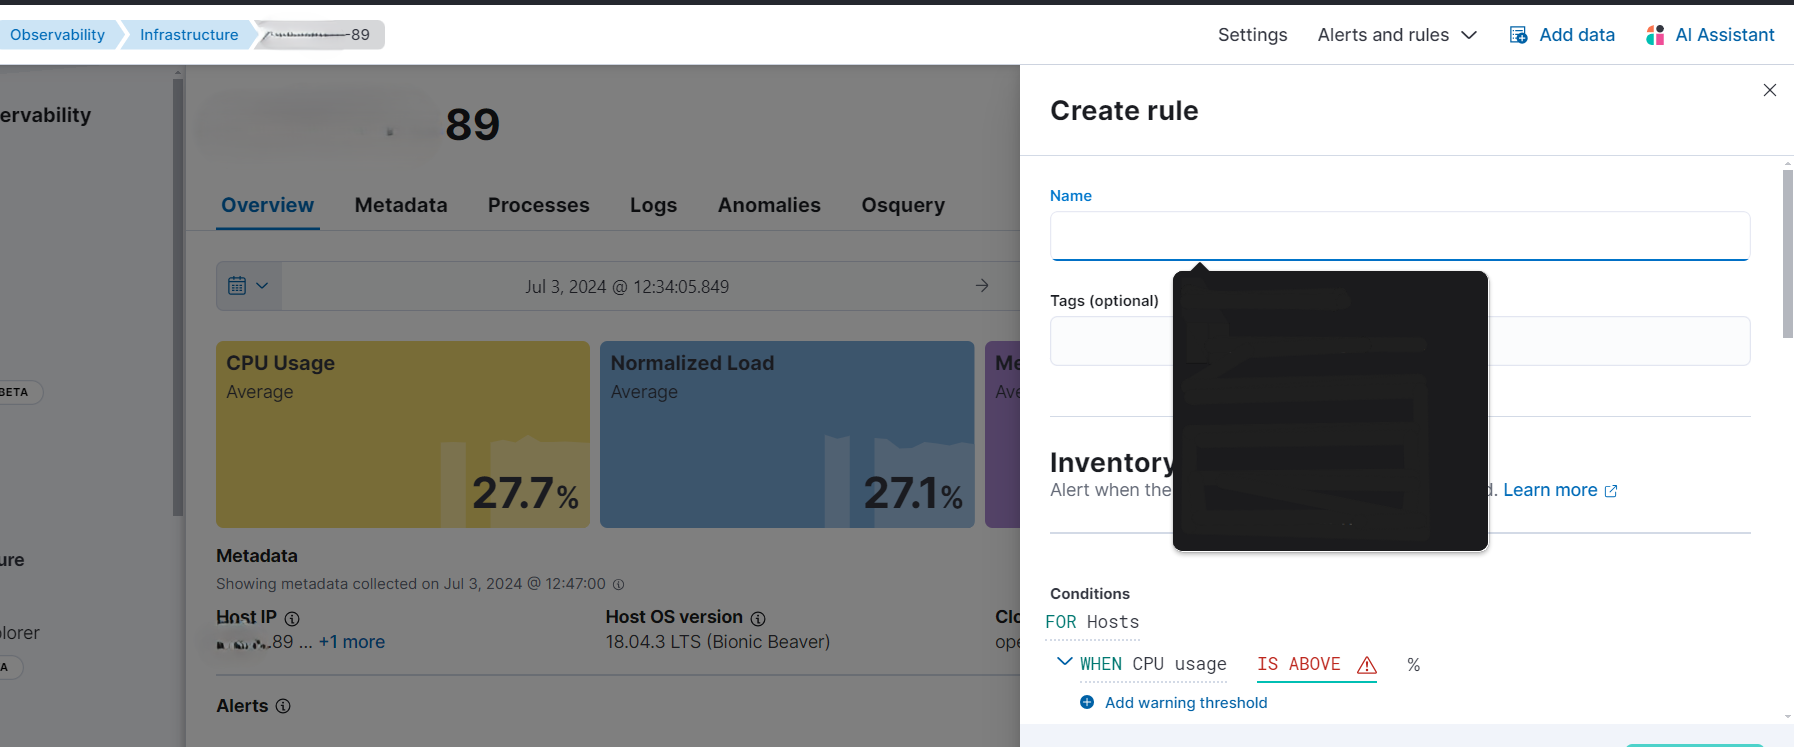
9. In Conditions, choose CPU usage and enter the target value (eg.80) in the IS ABOVE column, which means CPU spikes above 80% will receive the alert notification.
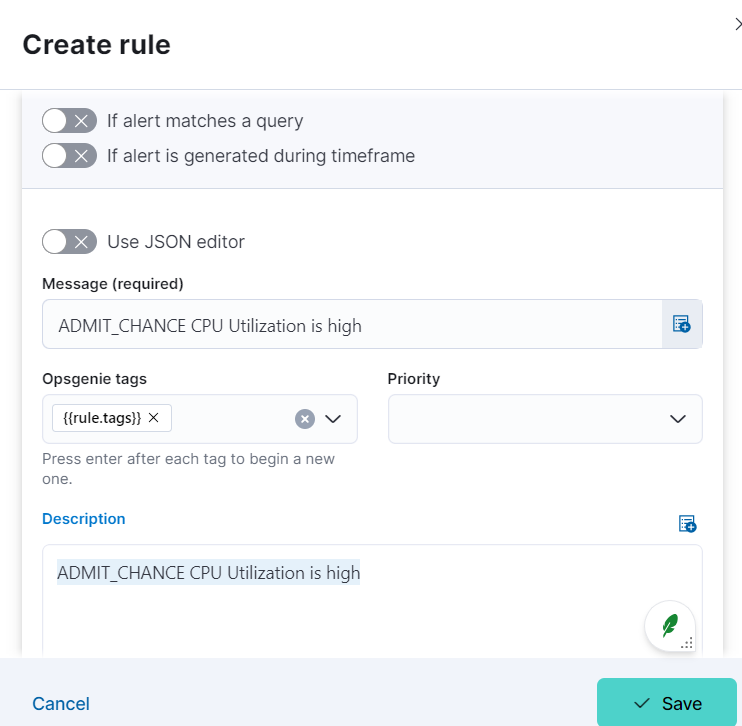
10. Scroll down in the action Tab, choose OpsGenie, and in the Message and Description box, enter the required message.
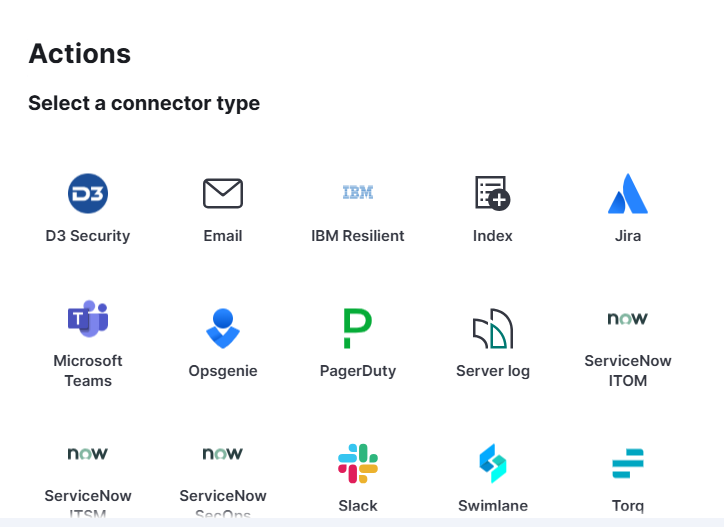
11. In the action menu, choose your required service to receive the alert.
Create the connector if it is not configured previously.
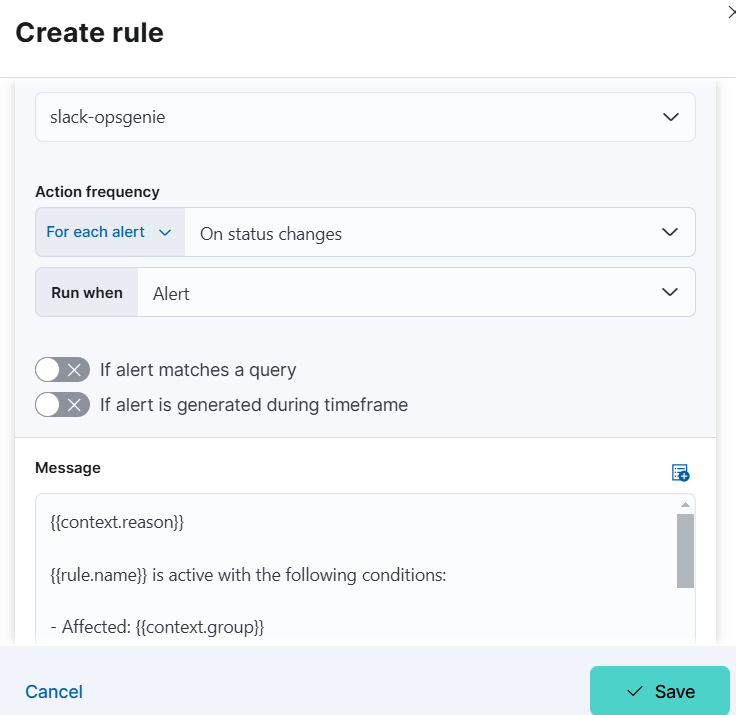
12. Choose save.
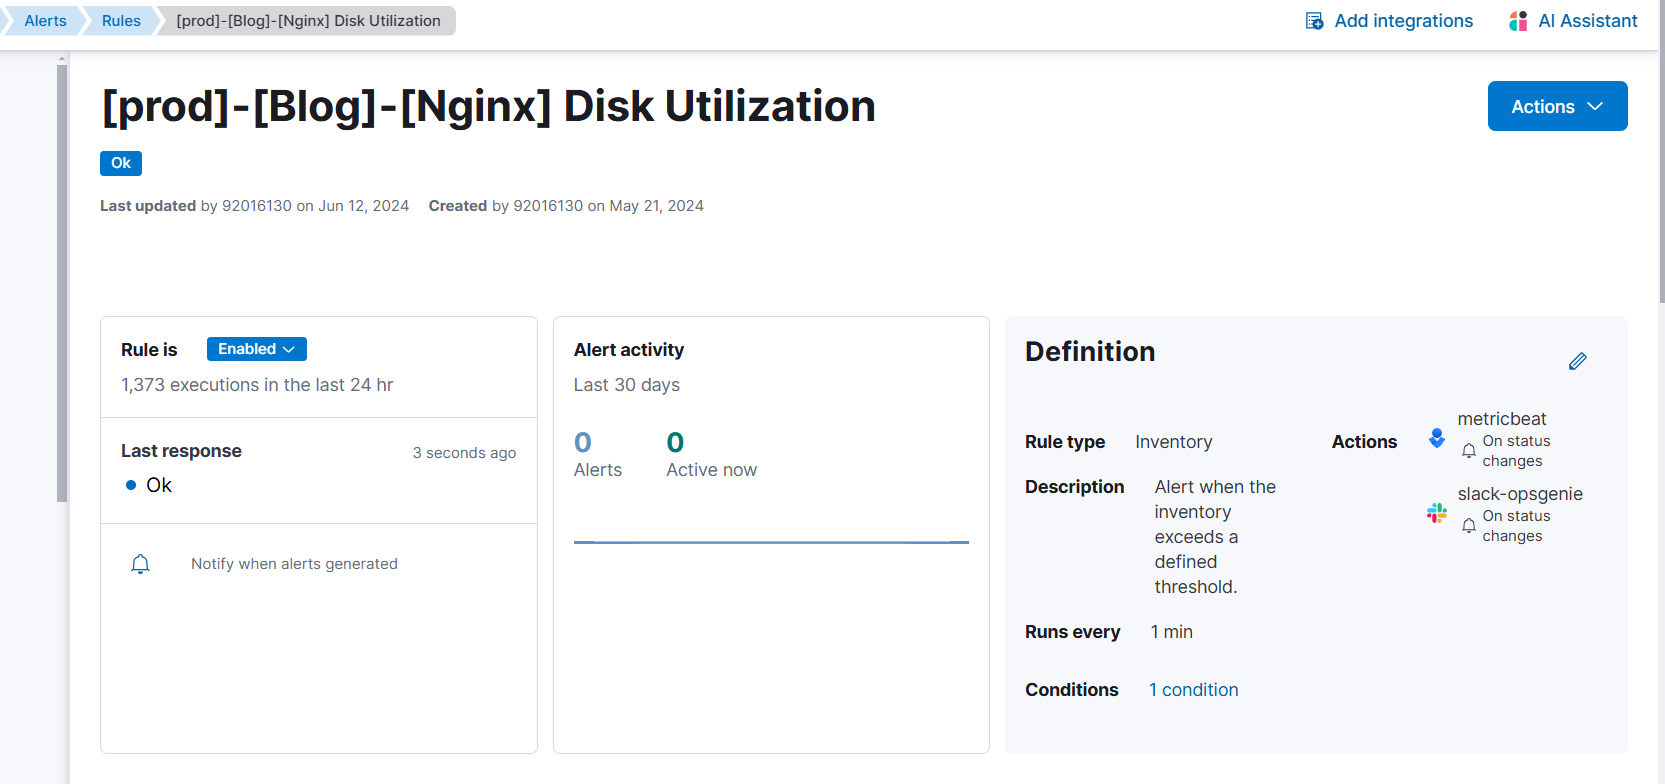
Check the rules have updated or not Observability-> Alerts -> Rules.