How to enable authentication for the Kibana dashboard using Apache webserver on Centos 7
How to enable authentication for the Kibana dashboard using Apache webserver on Centos 7
Date: 07-11-2020
Introduction:
Kibana is an open-source data visualization dashboard for Elasticsearch. Monitoring, managing, and securing an Elastic Stack instance via the web interface. The Kibana dashboard is a collection of charts, graphs, metrics, searches, and maps that have been collected together onto a single panel. By default, Kibana doesn’t support authentication for the dashboard so you can set up by using the following steps.
Step 01: First, you have to install the apache webserver.
Step 02: Once the apache webserver installed, You can create an HTTP username and provide the password by using the below command.
# htpasswd -c /etc/httpd/conf/.htpasswd kibanaadminNew password: # set password
Re-type new password: # confirm the same password
We have created the password for user name “kibanaadmin”
Step 03: We need to add created username and password details in the apache config file. By default, the Kibana dashboard works on port 5601. We can access the dashboard as monitor.pheonixsolutions.com rather than monitor.pheonixsolutions.com:5601 so you have to add the Proxypass rule on the config file. Add the following lines in the config file.
ProxyPreserveHost On
ProxyRequests On
ProxyPass / http://localhost:5601/
ProxyPassReverse / http://localhost:5601/
# Protecting with basic authentication
<Location />
AuthType Basic
AuthName “Restricted Content”
AuthUserFile /etc/httpd/conf/.htpasswd
Require valid-user
</Location>
Step 04: Once you complete the above steps. Restart the Apache webserver service to apply the changes.# systemctl restart httpd
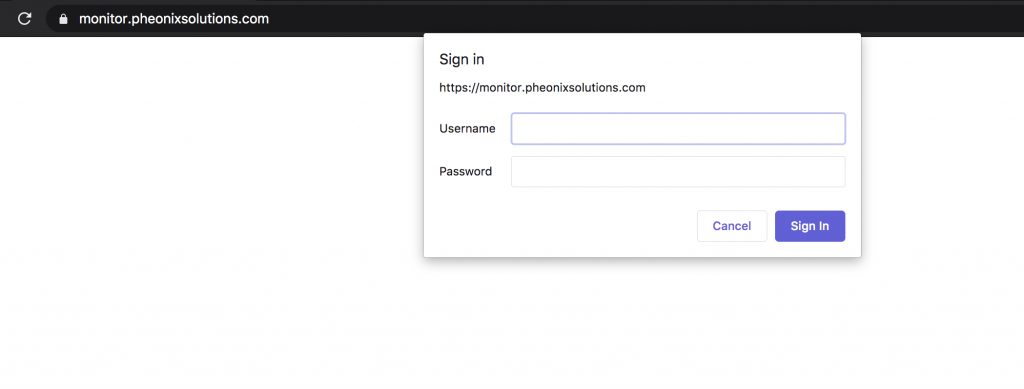
Step 05: Now open the browser and browse Ip address or FQDN, you get a User authentication POP UP asking for Username and password like below.
Thank you !