Kubernetes ELK Logging Setup (Filebeat → Logstash → Kibana)
Introduction
In modern containerized environments, centralized logging is essential for monitoring, troubleshooting, and maintaining application reliability. Kubernetes workloads generate logs across multiple pods and nodes, which makes log management challenging if logs remain distributed.
To solve this, organizations often use the ELK Stack (Elasticsearch, Logstash, and Kibana) for centralized logging and observability.
In this guide, we will configure Filebeat as a DaemonSet in Kubernetes to collect container logs from every node and forward them to an external Logstash server. Logstash processes these logs and stores them in Elasticsearch, while Kibana provides a powerful interface to search, analyze, and visualize logs.
By the end of this setup, Kubernetes logs will be centralised and searchable through Kibana.
Architecture
Kubernetes Pods
↓
Filebeat (DaemonSet)
↓
Logstash (ELK Server)
↓
Elasticsearch
↓
Kibana
- Filebeat collects logs from Kubernetes nodes.
- Logstash processes and formats logs.
- Elasticsearch stores logs as searchable indices.
- Kibana provides visualisation and search capabilities.
File Structure (Kubernetes)
filebeat/
├── filebeat.yaml
├── filebeat-config.yaml
├── filebeat-daemonset.yaml
├── filebeat-clusterrole.yaml
├── filebeat-clusterrolebinding.yaml
└── filebeat-serviceaccount.yaml
Each file is responsible for configuring Filebeat permissions, configuration, and deployment in Kubernetes.
Step-by-Step Installation
1. Create Namespace
First, create a dedicated namespace for monitoring components.
kubectl create namespace monitoringVerify the namespace:
kubectl get ns2. Apply Filebeat YAML Files
kubectl apply -f filebeat-serviceaccount.yaml -n monitoring
kubectl apply -f filebeat-clusterrole.yaml
kubectl apply -f filebeat-clusterrolebinding.yaml
kubectl apply -f filebeat-config.yaml -n monitoring
kubectl apply -f filebeat-daemonset.yaml -n monitoring
Verify the namespace:
kubectl get pods -n monitoring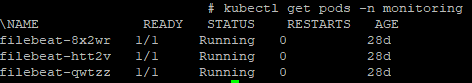
3. Verify Filebeat Configuration
kubectl exec -n monitoring <filebeat-pod-name> -- cat /usr/share/filebeat/filebeat.ymlExample:
output.logstash:
hosts: [":5046"]
This confirms that Filebeat will forward logs to the external Logstash server.
4. Configure Logstash on ELK Server
On the ELK server, create a Logstash pipeline configuration.
cd /etc/logstash/conf.d
vi kubernetes.conf
Example Logstash configuration:
input {
  beats {
    port => 5046
  }
}

filter {
  if [kubernetes][container][name] {
    mutate {
      add_field => {
        "index_name" => "k8s-%{[kubernetes][container][name]}-%{+YYYY.MM.dd}"
      }
    }
  }
}

output {
  elasticsearch {
    hosts => ["http://localhost:9200"]
    index => "%{index_name}"
  }
}
This configuration:
- Accepts logs from Filebeat
- Adds a dynamic index name based on container name
- Stores logs in Elasticsearch
5. Restart Logstash
After updating the configuration, restart Logstash.
systemctl restart logstashCheck service status:
systemctl status logstashMonitor logs:
tail -f /var/log/logstash/logstash-plain.log6. Verify Indices in Elasticsearch
Confirm that Elasticsearch is receiving logs.
curl -X GET "localhost:9200/_cat/indices?v"Expected indices:
k8s-myapp-app-YYYY.MM.dd
k8s-myapp-app-YYYY.MM.dd
These indices represent logs from Kubernetes containers.
7. Kibana – Index Management
Login to Kibana.
Navigate to:
Stack Management → Index Management
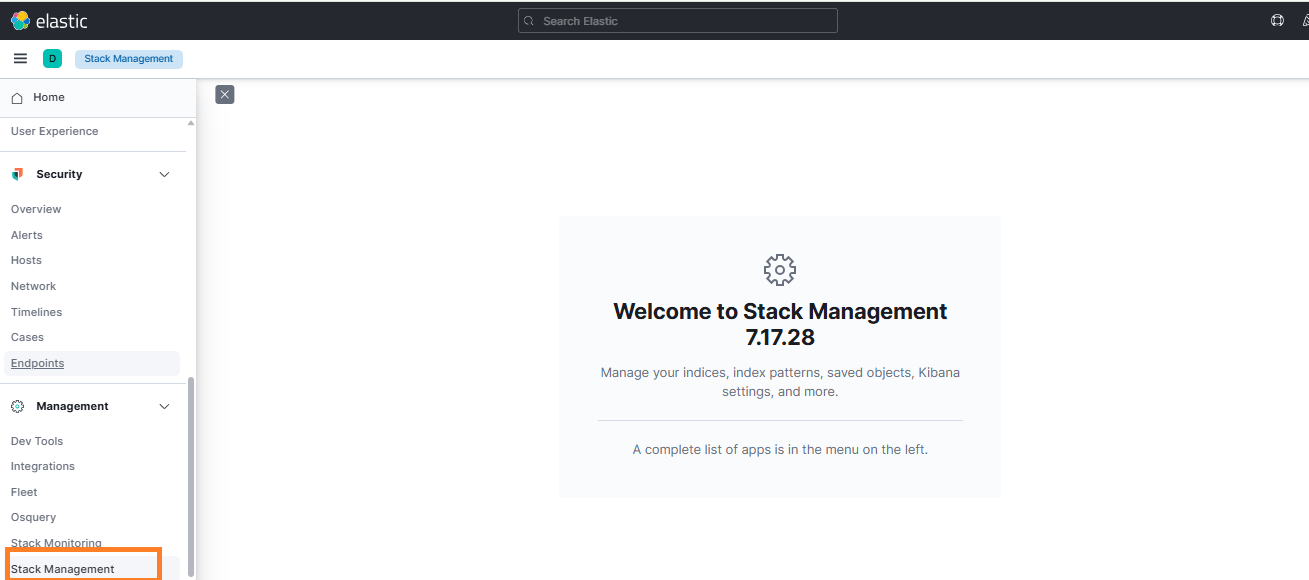
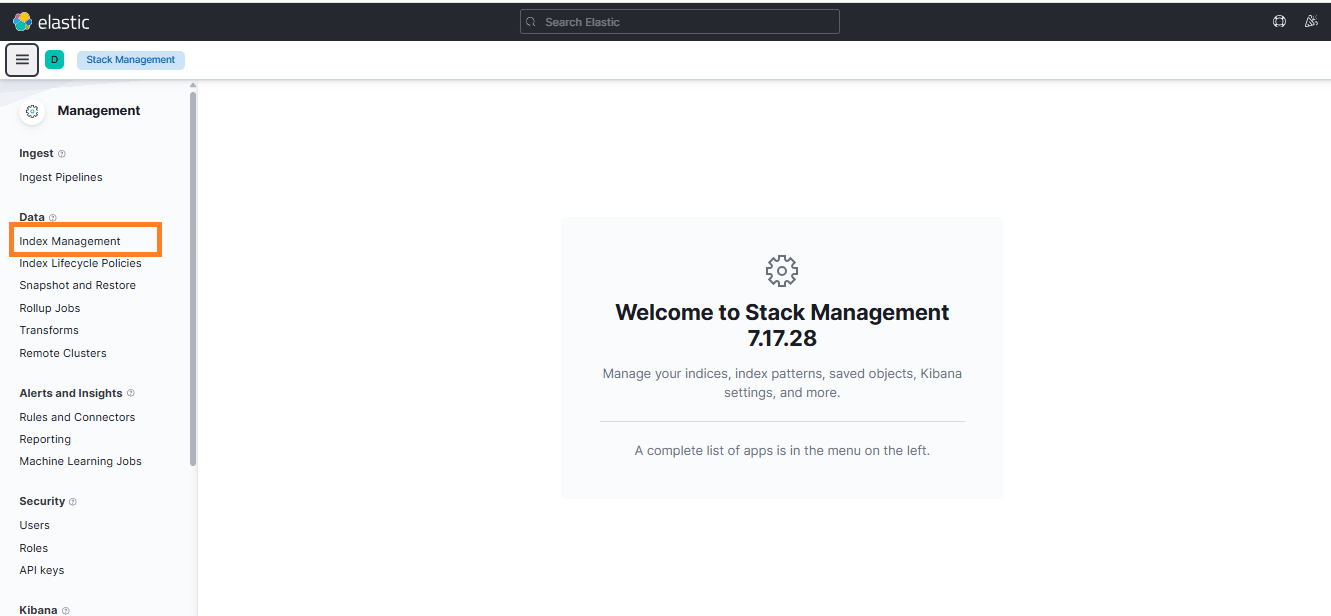
Verify that Kubernetes application indices are visible
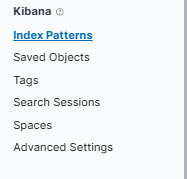
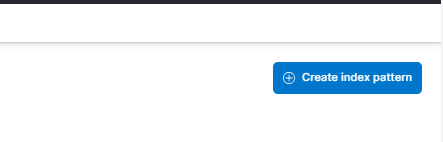
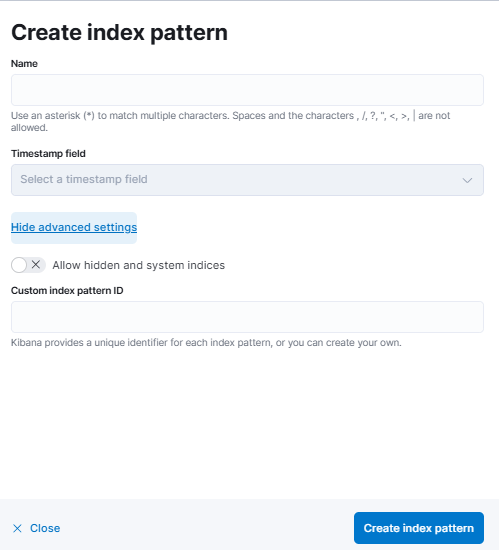
8 Create Index Pattern in Kibana
To view logs in Kibana, create an index pattern.
- Go to Stack Management → Index Patterns
- Click Create index pattern
- Enter the pattern:
k8s-* - Select time field:
@timestamp - Click Save
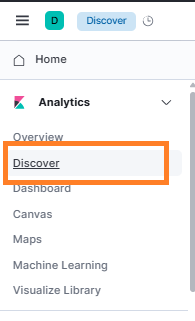
9 Verify Logs
Go to Discover in Kibana.
Select the newly created index pattern.
You can now filter logs by:
- Namespace
- Pod name
- Container name
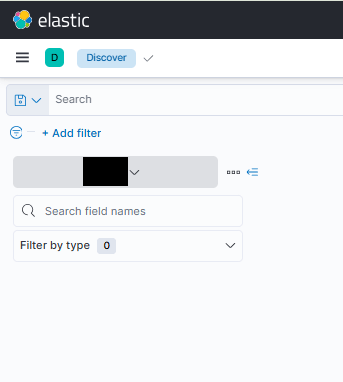
You should now see Kubernetes application logs flowing into Kibana.
Outcome
After completing this setup:
- Kubernetes logs are centralized
- Logs are automatically collected from all nodes
- Logs are stored in Elasticsearch
- Logs are searchable and visualized in Kibana
This provides improved observability and faster troubleshooting for Kubernetes workloads.
Important Notes
- Filebeat runs as a DaemonSet, ensuring log collection from every node.
- Logstash runs outside Kubernetes on the ELK server.
- Indices are created dynamically using container name and date.
- The setup supports scalable logging for production Kubernetes clusters.
Conclusion
Centralized logging is a critical component of operating Kubernetes in production. By integrating Filebeat, Logstash, Elasticsearch, and Kibana, you can efficiently collect, process, and analyze logs from distributed containers across your cluster.
This architecture ensures that logs are structured, searchable, and easily accessible, helping DevOps and SRE teams quickly identify issues, debug applications, and monitor system health.
Implementing this logging pipeline not only improves observability but also lays the foundation for advanced monitoring, alerting, and security analysis within your Kubernetes infrastructure.